Walt Disney World Crowd Report November 24 to 30, 2013 – Thanksgiving
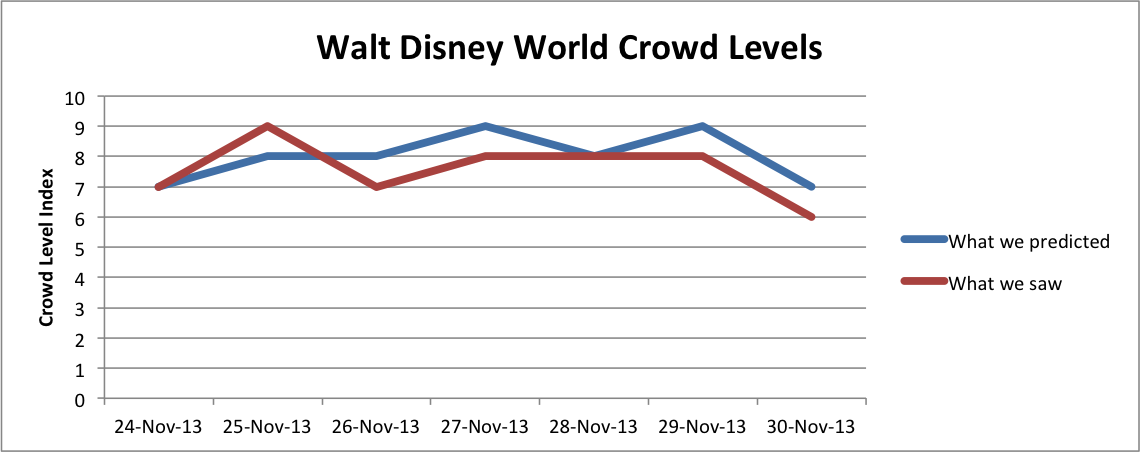
Like most Thanksgiving Holidays at Disney World, the final week of November 2013 proved to be a busy one. The resort hit a level ‘7’ on Sunday, November 24 and remained at that level or higher until Saturday, November 30. We’ve seen busier Thanksgiving weeks in the past, but still this was a very busy week for Disney World guests. Inevitably we hear from guests who tour the parks during a crowd level ‘8’ and say “Wow! I can’t imagine how crazy it must be during a 10!” If you visited Thanksgiving week we hope you used a touring plan and used Lines, our mobile app, to Optimize while in the parks. In general, our wait time predictions hit the mark with only a few exceptions. Most notably, our wait times models correctly predicted when wait times would start to surge (Sunday) from the influx of holiday guests and when they would begin to taper (Saturday). See below for our day-by-day Crowd Report of how the crowds looked Thanksgiving week.
| November 24 to 30, 2013 |
|---|
On Sunday we predicted Magic Kingdom, Epcot and The Studios to be a ‘7’ on our scale with Animal Kingdom one level higher at an ‘8’. Turns out that ‘7’ was the lucky number at all parks except The Studios which came in one level lower, thanks to lower than expected wait times at Rock ‘n Roller Coaster. Sunday before Thanksgiving is historically when we see an influx of guests beginning their holiday vacation and this pattern continued again this year. Sunday was the first day the resort hit above a level ‘6’ since Sunday, October 13.
On Monday, at the Magic Kingdom we were within a few minutes of correctly predicting the Mountains (65 mins at Big Thunder, 79 mins at Space Mountain, 48 mins at Splash Mountain) but we under-predicted the average posted wait times at other major attractions like Jungle Cruise (53 mins), Buzz Lightyear (59 mins) and Pirates of the Caribbean (35 mins). Those higher wait times pushed the park to a level ‘9’, two higher than the ‘7’ we predicted.
On Tuesday, the opposite occurred at the Magic Kingdom where wait times were lower than expected only hitting a ‘5’ on our scale. However, the predicted ‘7’ for Magic Kingdom was the lowest of the four parks so if you followed our recommendations you experienced the best day of the week to visit. The other three parks were predicted to be a level ‘8’ which ended up accurate for Epcot but one too high at The Studios and Animal Kingdom which came in at a level ‘7’.
All parks hit a level ‘8’ or ‘9’ on Wednesday. The only park where we missed was the Studios, where we predicted a level ‘9’ but observed a level ‘8’. Average posted waits between 10am and 5pm were 67 minutes at Space Mountain, 111 at Soarin’, 111 at Toy Story Mania and 52 at Expedition Everest. The cool weather kept the wait times low at the wet rides. Splash Mountain averaged 34 minutes and Kali River Rapids averaged 24 minutes.
Happy Thanksgiving! High wait times continued with all parks hitting a level ‘7’ or higher. Animal Kingdom wait times were the biggest surprise with Kilimanjaro Safaris reaching a 74 minute average posted wait. Dinosaur also peaked higher than expected, hitting an average posted wait time of 43 minutes. The other Animal Kingdom attractions were within predicted ranges so it was those two attractions that pushed the park wide level to ‘9’, up two from our predicted ‘7’.
Black Friday! The only things more crowded than the retail outlets are the Theme Parks, although one level lower than we predicted. The predicted resort wide ‘9’ ended up being one level too high thanks to lower than expected waits at Epcot and the Studios. Soarin’ and Test Track did average more than 100 minutes but we predicted 135 and 129 respectively. We also overshot the average wait at Tower of Terror by 15 minutes.
Our models correctly predicted that the wait times would start to lessen on Saturday. This was especially true at the Studios where we overshot by three index points. All three headliners came in 20 – 40% lower than expected. Tower of Terror averaged 44 minutes (predicted 81), Toy Story Mania averaged 87 minutes (predicted 114) and Rock ‘n’ Roller Coaster averaged 57 minutes (predicted 78). Across the resort the crowd levels hit ‘6’ on our index, we predicted ‘7’.
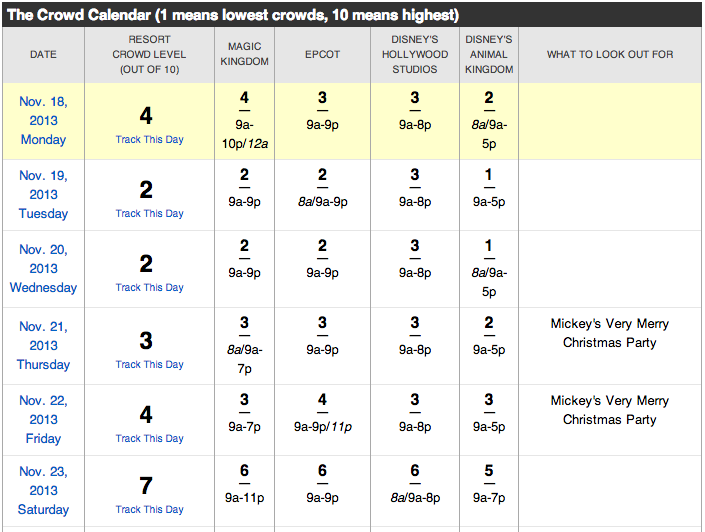
To see Walt Disney World Crowd predictions for the days of your vacation, check the Crowd Calendar.
The separately ticketed Mickey’s Very Merry Christmas Party continues on many nights at Magic Kingdom, which means savvy planners who don’t mind the shortened park hours can experience low wait times during the day.![]()
To get details about our predictions of future crowds or details about crowds in the past check out the Crowd Calendar and select “Jump to Date” on the left margin.
You May Also Like...
-

This weekend will have the longest park hours since Walt Disney World re-opened in July. Extended park hours are a signal…
-

The November Crowd Calendar update is now live. We are approaching the busiest time at Walt Disney World: New Year's, Christmas,…
-

Are you craving a last-minute vacation to Walt Disney World? November is a great time to visit! Here's our top five…
-
The February 2020 Crowd Calendar update is now live. So far 2020 is showing increased crowds at Walt Disney World. We…