Walt Disney World Crowd Report – February 2 to 8, 2014
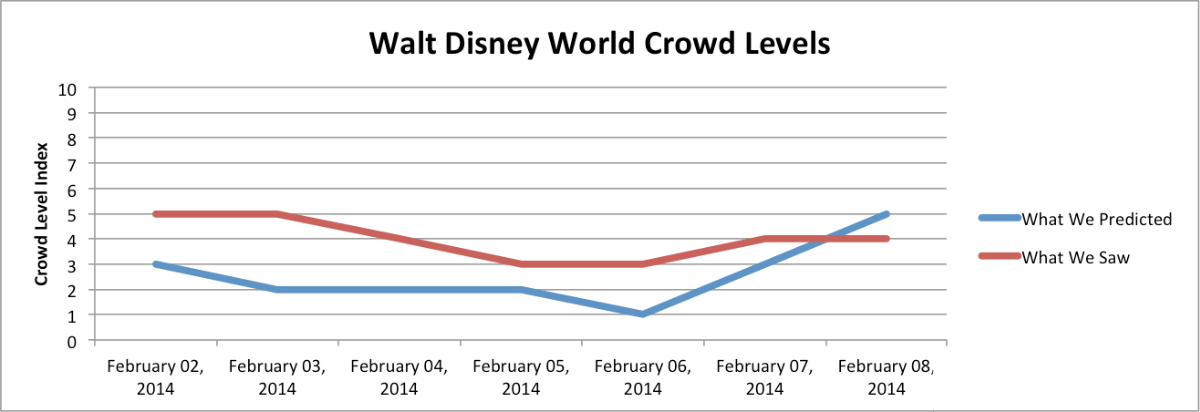
In general, our predictions came in too low this past week, with warm weather bringing out some larger than expected crowds. Resort-wide levels never did peak above average, though, so it was a still a great week to visit the parks. Some park levels surprised us this week, especially at Animal Kingdom and Hollywood Studios, and more specifically at attractions other than the super headliners. This may be a symptom of FastPass+ integration throughout the resort since guests can not repeat super headliners as easily in a given day. Regardless, our attraction estimates performed well, meaning that those of you who used our touring plan optimizer experienced near optimal conditions if you followed the plan.
Let’s look at how the crowd levels stacked up day-to-day.
| February 2, 2014 to February 8, 2014 |
|---|
Super Bowl Sunday brought some higher than expected crowds to Magic Kingdom and Animal Kingdom. Magic Kingdom reached a level ‘7’ on our scale, and Animal Kingdom an ‘8’, much higher than the ‘4’ and ‘3’ we predicted, respectively. Surprisingly, though, our attraction predictions were fairly accurate in most cases.![]() We may have to look closely at some specific attractions to see if FastPass+ is causing a distinct impact. For example, on Sunday Space Mountain reached an average posted time of 43 minutes while Pirates of the Caribbean averaged 31 minutes. Normally these two attractions would have a much larger difference than that.
We may have to look closely at some specific attractions to see if FastPass+ is causing a distinct impact. For example, on Sunday Space Mountain reached an average posted time of 43 minutes while Pirates of the Caribbean averaged 31 minutes. Normally these two attractions would have a much larger difference than that.
Some surprisingly large crowds continued at Animal Kingdom on Monday, with a park-wide level of ‘6,’ although no attraction had an average posted time above 36 minutes. Nice weather brought unseasonably large wait times at Kali River Rapids (29 minute average) and Kilimanjaro Safaris (36 minutes), although Expedition Everest came in lower than we predicted at 26 minutes (predicted 34). Hollywood Studios had larger than expected crowds, while Magic Kingdom (5) and Epcot (4) came in as expected.
Increases continued on Tuesday, with the resort wide crowd level reaching a ‘4’ on our scale, two higher than predicted. Still, crowds are below average and manageable with a touring plan. Epcot hosted Extra Magic Hour morning and brought in below average crowds as expected, reaching a level ‘3’ on our scale.
Crowds settled slightly on Wednesday, with no park reaching a crowd level above ‘4’. The Studios reached ‘4’ while Epcot and Animal Kingdom reached ‘3’ and Magic Kingdom was a ‘2’. Magic Kingdom wait times were some of the lowest we’ve seen in several weeks, with Peter Pan’s Flight averaging only 41 minutes, much lower than normal. Big Thunder Mountain averaged only 25 minutes and Space Mountain a minuscule 15 minutes.
Resort-wide crowds reached a level ‘3’ on Thursday, two higher than predicted thanks to some slightly higher waits at Epcot, Hollywood Studios, and Animal Kingdom, although all of those three parks stayed at a level ‘3.’ Extra Magic Hour morning at Magic Kingdom brought in a level ‘4’ crowd as predicted. Test Track had the highest waits at Epcot with an average of 57 minutes (predicted 37), while DINOSAUR took that prize at Animal Kingdom with a 22-minute average (predicted 18). At the Studios, Toy Story Mania averaged 62 minutes, a little less than double the next highest average (Rock ‘n’ Roller Coaster at 36 minutes).
Friday’s predictions were all within one index level of what we observed, although in each case we underestimated. The Studios and Animal Kingdom were the lowest two, as predicted. Epcot’s Extra Magic Hour evening brought slightly higher than expected waits at Test Track (63 minute average, predicted 48), while Magic Kingdom had the highest crowds, although no wait time averaged more than 55 minutes.
Extra Magic Hour morning at the Studios saw wait times three levels higher than predicted (‘6,’ predicted ‘3’), although we correctly predicted the average wait time at Toy Story Mania (69 minutes) within 4 minutes. Resort-wide, crowds were actually one index level lower than we predicted thanks to moderate waits at the other three parks.
| February 9 to 15, 2014 |
|---|
As we head into the next holiday season at Walt Disney World, we will find crowds starting to build on Thursday or Friday and continue through President’s Week.
To see Walt Disney World Crowd predictions for the days of your vacation, check the Crowd Calendar.
![]()
To get details about our predictions of future crowds or details about crowds in the past check out the Crowd Calendar and select “Jump to Date” on the left margin.
You May Also Like...
-

This weekend will have the longest park hours since Walt Disney World re-opened in July. Extended park hours are a signal…
-

The February 2020 Crowd Calendar update is now live. So far 2020 is showing increased crowds at Walt Disney World. We…
-
The October Crowd Calendar update is now live. We skipped September to give the models a chance to digest the data with Star…
-

A new Disney Visa discount offer for Walt Disney World vacations has just been released. Here's the details: This offer is…
I’m also curious about your April predictions… you have the week of April 13 showing at 8’s and then a 9 on Thursday… but last year in 2013 April was NEVER that high. Why is that? We are deciding between Florida and California for spring break, and your prediction might tilt it! 🙂
Thank you for these weekly reports. Is there a point where you believe you will be able to predict differences for the same periods as last year based on the Fastpass+ changes? I am tracking December 6 – 14, 2014 and am curious on your expert opinion of when the crowd estimate would be stable.