Walt Disney World Crowd Report – March 30 to April 5, 2014
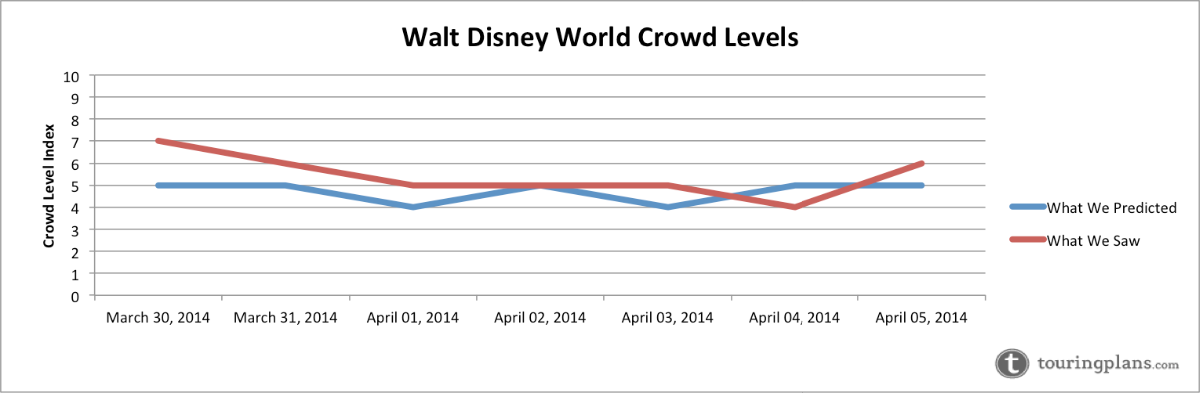
Last week we saw crowds fade to levels lower than that of the previous week. It appears that Sunday was the last day of a Spring Break peak that was followed by busy but manageable crowds. Our predictions did very well with none missing by more than two index levels all week. We also correctly predicted differences between park crowd levels on most days.
Let’s look at how the crowd levels stacked up day-to-day last week.
| March 30, 2014 to April 5, 2014 |
|---|
While predictions for Magic Kingdom (7) and Disney’s Hollywood Studios (5) proved accurate on Sunday, we underpredicted Epcot and Animal Kingdom by two levels. Soarin’ averaged 86 minutes (we predicted 65) while most other attractions were only off by a few minutes. Similarly, Animal Kingdom’s higher than expected crowd level came from mostly from one attraction, Kilimanjaro Safaris. We predicted a 26-minute average posted wait while the observed value was almost double, at 50 minutes. Resort-wide, the crowd level ‘7’ ended up the highest level we would see all week.
Monday’s resort-wide crowd level was one level lower than Sunday but one level higher than the ‘5’ we predicted. This was mainly due to slightly higher than expected waits at Epcot. Soarin’s wait times were a little higher again but so were the wait times at Spaceship Earth (18 minutes, predicted 9). Wait times at Test Track were higher than predicted (75 minutes) but not significantly so (we predicted 64 minutes). We correctly predicted that Magic Kingdom would have a higher crowd level than the other parks when it reached a level ‘7’ on Monday, one level higher than the ‘6’ we predicted.
If there were any April fools in the parks on Tuesday they chose Magic Kingdom (7) or Animal Kingdom (6) for their park to visit. Crowds at the other two parks were much lighter including a crowd level ‘3’ at The Studios. Our only misses were our predictions for Epcot (predicted ‘4’) and The Studios (predicted ‘2’) but we only missed low by one index level in both cases, not bad.
Predictions did very well on Wednesday as well with accurate crowd levels for The Studios (4), Animal Kingdom (7) and the overall resort-wide crowd level (5). We overpredicted Magic Kingdom and underpredicted Epcot but only by one in both cases (Epcot was a ‘4’, Magic Kingdom was a ‘6’). Soarin’ at Epcot surprised us again with a 103-minute average posted time (we predicted 52). This is surprising given than Test Track only averaged 59 minutes and other Epcot attractions barely reached double-digits.
Extra Magic Hour morning on Thursday brought a crowd level ‘7’ to Magic Kingdom as predicted. We saw average posted times of 50 minutes for Peter Pan’s Flight (predicted 52), 28 minutes for Pirates of the Caribbean (predicted 24) and 28 minutes for Haunted Mansion (predicted 25). Resort-wide the crowd level was a respectable ‘5’, one higher than the ‘4’ we predicted. The crowd levels by park were quite different. Animal Kingdom matched the ‘7’ at Magic Kingdom (we predicted ‘5’) while The Studios was only a ‘2’ (we predicted ‘4’). Epcot crowds remained moderate at a level ‘5’, one level higher than predicted.
Crowd levels remained very low at The Studios on Friday with a second day at level ‘2’. Toy Story Mania at 62 minutes was the only Studios attraction that averaged more than 50 minutes. Once again, other parks varied a lot. Magic Kingdom saw a crowd level ‘6’, one level lower than predicted while Epcot and Animal Kingdom were ‘4’ and ‘5’ respectively. This brought the resort-wide crowd level to a ‘4’, one lower than our prediction of ‘5’, the lowest resort-wide crowd level of the week.
Resort-wide the crowd level jumped up two spots on Saturday to the still moderate level ‘6’ (we predicted ‘5’). Magic Kingdom was a ‘6’ as predicted while our predictions of crowd level ‘4’ at the other three parks proved accurate only at The Studios. At Epcot and Animal Kingdom we observed crowd levels of ‘6’ although our predictions were not that far off for all attractions.
| April 6 to April 12, 2014 |
|---|
We suspect that this week will be the last week before we see increased crowd levels for Easter. Crowds should remain moderate if not low throughout the week until Sunday, April 13th when we expect Easter travellers to arrive.
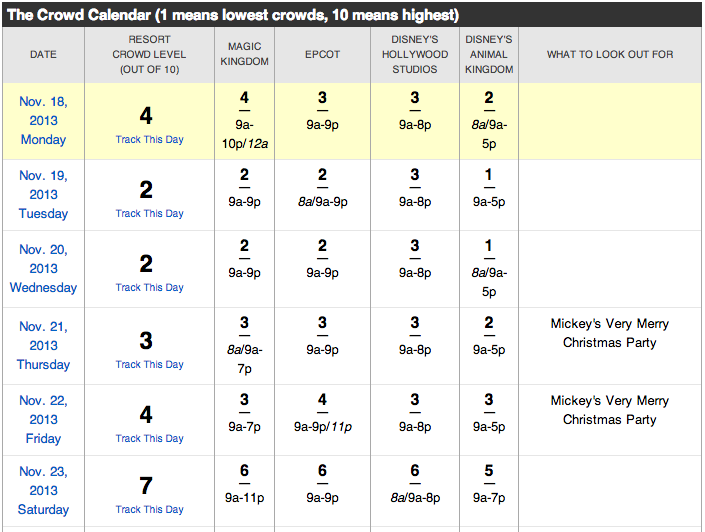
To see Walt Disney World Crowd predictions for the days of your vacation, check the Crowd Calendar.![]()
To get details about our predictions of future crowds or details about crowds in the past check out the Crowd Calendar and select “Jump to Date” on the left margin.
You May Also Like...
-

This weekend will have the longest park hours since Walt Disney World re-opened in July. Extended park hours are a signal…
-
The April Crowd Calendar update only has minor changes. We are halfway through spring break, and crowd levels have been in-line…
-

The February 2020 Crowd Calendar update is now live. So far 2020 is showing increased crowds at Walt Disney World. We…
-
The October Crowd Calendar update is now live. We skipped September to give the models a chance to digest the data with Star…
I have been to Disney World 4 times,and while I love Soarin’, it is always a wait due to technical issues. Every time we have had a fast pass and have wound up with a technical issue. Going in October and anxious to see how FP+ works out.
We were at Epcot on Wednesday and the line for Soarin’ was 90 minutes in the morning. It should have only been an hour, but when we got to the front and were the next to go in, the side we were on broke down and we waited in the gates for half an hour until they rerouted us to the other side. Long wait with 2 small children, one of them being autistic and it threw our whole touring plan off.
We were there last week and had a great week, thanks to the personalized touring plans and Optimizer feature on Lines. Keep up the great work!
I noticed that Soarin ended up higher than expected on a few days this week. Any idea why that would be?
1 last thought: it would be great if you could run a projected wait time for Dole Whip at Aloha Isle and enable a way to put it into a touring plan. Line was crazy long on Friday! 🙂
Not sure, Brian. Soarin’ is usually quite predictable so when we miss it is often because they have technical problems with the attraction. That may or may not have been the case last week. If they have to close one side of the attraction, even if it is only for a short time, the posted time can spike significantly.
Could very well have been technical difficulties, at least on Wednesday the 2nd. We were there in the morning and the pre-show seemed to take a lot longer than usual to start. Then we overheard a cast member explaining to a guest they were having some technical issues that morning.