Disney World Crowd Report – July 6 to 12, 2014
Last week we updated our Crowd Calendar and our predictions bounced back nicely. We saw most park levels within expected ranges of our predictions. Crowds were still skewing lower than normal but not significantly so as was the case the past several weeks.
Let’s look at how the crowd levels stacked up each day last week:
| WHAT WE THOUGHT |
WHAT WE SAW |
ANALYSIS | |
|---|---|---|---|
| Magic Kingdom |
6
|
4
|
An average day across the resort which is fairly unusual for mid-July. Magic Kingdom and Epcot were the better choices Sunday even though Magic Kingdom opened until 2:00 am with Extra Magic Hour evening. Wait times were slightly higher at the other two parks but still quite manageable. |
| Epcot |
5
|
3
|
|
| Hollywood Studios |
7
|
6
|
|
| Animal Kingdom |
8
|
6
|
|
| WHAT WE THOUGHT |
WHAT WE SAW |
ANALYSIS | |
| Magic Kingdom |
7
|
7
|
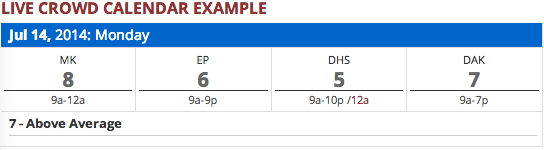
All of Monday’s predictions fell within acceptable limits including a correct prediction of ‘7’ at Magic Kingdom. Spaceship Earth was the resort’s biggest surprise with a 25-minute average posted wait (a ’10’ on our scale). |
| Epcot |
4
|
5
|
|
| Hollywood Studios |
6
|
7
|
|
| Animal Kingdom |
5
|
6
|
|
| WHAT WE THOUGHT |
WHAT WE SAW |
ANALYSIS | |
| Magic Kingdom |
7
|
8
|
Lower than expected wait times at Epcot, Hollywood Studios and Animal Kingdom pushed the resort wide level two points lower than predicted. Magic Kingdom went the other way thanks to a 67-minute average wait at Space Mountain. |
| Epcot |
7
|
6
|
|
| Hollywood Studios |
6
|
5
|
|
| Animal Kingdom |
8
|
6
|
|
| WHAT WE THOUGHT |
WHAT WE SAW |
ANALYSIS | |
| Magic Kingdom |
8
|
7
|
Higher crowds than the previous three days rolled in on Wednesday. Animal Kingdom was especially crowded including a 64-minute average wait at Kali River Rapids. |
| Epcot |
5
|
5
|
|
| Hollywood Studios |
6
|
7
|
|
| Animal Kingdom |
9
|
9
|
|
| WHAT WE THOUGHT |
WHAT WE SAW |
ANALYSIS | |
| Magic Kingdom |
8
|
7
|
By comparison, Kali River Rapids dipped to a 45-minute average on Thursday, pushing the crowd level three points lower than predicted and three points lower than the day before. Soarin’s waits were low as well, only a 58-minute average on Thursday. |
| Epcot |
7
|
5
|
|
| Hollywood Studios |
6
|
6
|
|
| Animal Kingdom |
9
|
6
|
|
| WHAT WE THOUGHT |
WHAT WE SAW |
ANALYSIS | |
| Magic Kingdom |
6
|
6
|
Solid predictions resort-wide on Friday, with the noted exception of Spaceship Earth at 22-minutes. Even Living with the Land at 7 minutes was higher than normal. Otherwise, our predictions hit the mark. |
| Epcot |
5
|
7
|
|
| Hollywood Studios |
6
|
6
|
|
| Animal Kingdom |
6
|
5
|
|
| WHAT WE THOUGHT |
WHAT WE SAW |
ANALYSIS | |
| Magic Kingdom |
4
|
4
|
We didn’t believe our predictions for low crowds on Saturday but they ended up accurate. In fact, Animal Kingdom was less crowded than expected. Anyone in that park experienced the rare crowd level ‘2’ in summer. |
| Epcot |
3
|
3
|
|
| Hollywood Studios |
6
|
6
|
|
| Animal Kingdom |
5
|
2
|
|
| July 13 to 19, 2014 |
|---|
Crowd levels are expected to be higher this week than they were last week. The ‘4’s and ‘5’s will be replaced with ‘7’s and ‘8’s.
To see Walt Disney World Crowd predictions for the days of your vacation, check the Crowd Calendar.![]()
To get details about our predictions of future crowds or details about crowds in the past check out the Crowd Calendar and select “Jump to Date” on the left margin.
You May Also Like...
-

All four Disney World Parks are now open and crowd levels can be described in one word. Low. Every day has…
-

This weekend will have the longest park hours since Walt Disney World re-opened in July. Extended park hours are a signal…
-
Summer is officially here and July's Crowd Calendar update is now live. If you are tracking the crowd levels on your…
-
Crowded theme parks during the Christmas holiday are as certain as death and taxes. Every year we see crowd levels hit…