Disney World Crowd Report – July 20 to 26, 2014
Predictions did remarkably well last week with most days hitting the mark. We saw higher than average wait times, typical of summer crowds with the exception of a slow Saturday. Crowds at Disney Hollywood Studios have bounced back from a slow spring, with wait times in the upper ‘7’s and ‘8’s.
Let’s look at how the crowd levels stacked up each day last week on the TouringPlans.com Disney World Crowd Report:
| WHAT WE THOUGHT |
WHAT WE SAW |
ANALYSIS | |
|---|---|---|---|
| Magic Kingdom |
6
|
6
|
Our predictions swept the board on Sunday with observations matching predictions at each park. There were similar crowd levels at all four parks, a common trait of summer days. |
| Epcot |
5
|
5
|
|
| Hollywood Studios |
6
|
6
|
|
| Animal Kingdom |
7
|
7
|
|
| WHAT WE THOUGHT |
WHAT WE SAW |
ANALYSIS | |
| Magic Kingdom |
8
|
8
|
Magic Kingdom was an ‘8’ as expected but elsewhere, we saw crowds two levels higher than predicted. Biggest surprises were Spaceship Earth (32 minute average, predicted 12), Toy Story Mania (92, predicted 60) and Kilimanjaro Safaris (28 minute average, predicted 18). |
| Epcot |
5
|
7
|
|
| Hollywood Studios |
6
|
8
|
|
| Animal Kingdom |
5
|
7
|
|
| WHAT WE THOUGHT |
WHAT WE SAW |
ANALYSIS | |
| Magic Kingdom |
8
|
8
|
Close across the board again Tuesday with slightly high wait times at Epcot and The Studios driven by non-headliners like Spaceship Earth and Living with the Land. Toy Story Mania saw higher waits as well, with an average posted time of 83 minutes (predicted 69). |
| Epcot |
8
|
9
|
|
| Hollywood Studios |
7
|
8
|
|
| Animal Kingdom |
8
|
8
|
|
| WHAT WE THOUGHT |
WHAT WE SAW |
ANALYSIS | |
| Magic Kingdom |
8
|
8
|
Great results again on Wednesday including our third day in a row of correct predictions at Magic Kingdom. Summer time crowds tend to be consistent and predictable, especially in mid-July. |
| Epcot |
7
|
6
|
|
| Hollywood Studios |
7
|
8
|
|
| Animal Kingdom |
8
|
9
|
|
| WHAT WE THOUGHT |
WHAT WE SAW |
ANALYSIS | |
| Magic Kingdom |
9
|
7
|
Animal Kingdom was the busiest park at a level ‘9’ on our scale while the other three parks hit a level ‘7’. |
| Epcot |
8
|
7
|
|
| Hollywood Studios |
7
|
7
|
|
| Animal Kingdom |
7
|
9
|
|
| WHAT WE THOUGHT |
WHAT WE SAW |
ANALYSIS | |
| Magic Kingdom |
8
|
6
|
Lowest crowd of the week at Magic Kingdom on Friday. It was the best park by one level as well, compared the the level ‘7’ we observed at the other three parks. |
| Epcot |
8
|
7
|
|
| Hollywood Studios |
6
|
7
|
|
| Animal Kingdom |
7
|
7
|
|
| WHAT WE THOUGHT |
WHAT WE SAW |
ANALYSIS | |
| Magic Kingdom |
6
|
5
|
Surprisingly low crowds across the board on Saturday. Only a ‘5’ at Magic Kingdom and only a ‘3’ at Animal Kingdom. Epcot was the only park that matched the prediction. |
| Epcot |
6
|
6
|
|
| Hollywood Studios |
8
|
7
|
|
| Animal Kingdom |
5
|
3
|
|
| July 27 to August 2, 2014 |
|---|
Summer crowds will continue through mid-August when some school districts begin their 2014-2015 school year. Weekends are tending to be slightly less predictable than weekdays so visiting the parks on a Saturday or Sunday may not be as bad as one thinks.
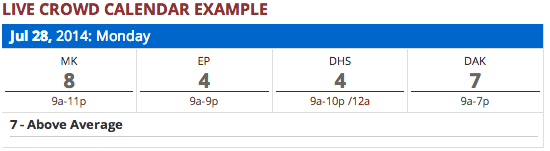
To see Walt Disney World Crowd predictions for the days of your vacation, check the Crowd Calendar.![]()
To get details about our predictions of future crowds or details about crowds in the past check out the Crowd Calendar and select “Jump to Date” on the left margin.
You May Also Like...
-

All four Disney World Parks are now open and crowd levels can be described in one word. Low. Every day has…
-

This weekend will have the longest park hours since Walt Disney World re-opened in July. Extended park hours are a signal…
-
Summer is officially here and July's Crowd Calendar update is now live. If you are tracking the crowd levels on your…
-
Crowded theme parks during the Christmas holiday are as certain as death and taxes. Every year we see crowd levels hit…
We were there last week and indeed found not-so terrible crowds at Magic Kingdom. Everything worked perfect following our optimized plnas, Thank you Touring Plans!!! we were able to ride 7DMFT twice in our vacation even though the ride was frequently out of service due to weather. We also found an average of 10-15 min wait at kiosks throughout the day, except City Hall in the afternoon which is a 5 min wait. Could you include wait times in the kiosks to be posted in the app?
I am a passholder but find that the 30 day FP+ booking window inadequate for new attractions such as SDMT or Frozen meet. Do you have some program or algorithm that indicates how far in advance certain attractions FP+ sell out?