Disney World Crowd Report – August 10 to 16, 2014
Predictions did remarkably well at Magic Kingdom and Animal Kingdom last week with all days hitting the mark or missing by only one index level (except for Monday at Animal Kingdom where we missed by two). Predictions were solid most days for The Studios and Epcot as well although crowds did skew higher at those parks. Frozen themed activities may be impacting the crowds at those two parks. Wait times at Spaceship Earth were up all week which pushed Epcot’s crowds higher than expected a few days last week.
Let’s look at how the crowd levels stacked up each day last week on this week’s Disney World Crowd Report:
| WHAT WE THOUGHT |
WHAT WE SAW |
ANALYSIS | |
|---|---|---|---|
| Magic Kingdom |
6
|
6
|
Sixes across the resort except for Epcot (4). No attraction at Magic Kingdom hit an average wait time higher than 54 minutes (Splash Mountain) and all of our predictions were within one index level. |
| Epcot |
3
|
4
|
|
| Hollywood Studios |
5
|
6
|
|
| Animal Kingdom |
6
|
6
|
|
| WHAT WE THOUGHT |
WHAT WE SAW |
ANALYSIS | |
| Magic Kingdom |
7
|
8
|
Epcot trailed the pack again on Monday with low wait times at Soarin’ (61 minutes, predicted 73) and Mission: Space Orange (19 minutes, predicted 25). We correctly predicted Buzz Lightyear at Magic Kingdom would average 48 minutes (a level ’10’ out of ’10’ for that attraction). Pirates of the Caribbean (45 minutes) and Space Mountain (73 minutes) hit a level ’10’ as well. |
| Epcot |
6
|
5
|
|
| Hollywood Studios |
7
|
8
|
|
| Animal Kingdom |
5
|
7
|
|
| WHAT WE THOUGHT |
WHAT WE SAW |
ANALYSIS | |
| Magic Kingdom |
7
|
8
|
Epcot hit the highest point on our scale thanks to higher than expected waits at Mission: Space Orange (55 minutes, predicted 34), Spaceship Earth (26 minutes, predicted 15) and Soarin’ (89 minutes, predicted 81). Crowds were up at The Studios as well (Rock ’n’ Roller Coaster 73 minutes, Toy Story Midway Mania 83 minutes) but within normal ranges at the two Kingdoms. |
| Epcot |
7
|
10
|
|
| Hollywood Studios |
6
|
9
|
|
| Animal Kingdom |
6
|
6
|
|
| WHAT WE THOUGHT |
WHAT WE SAW |
ANALYSIS | |
| Magic Kingdom |
8
|
7
|
Spaceship Earth averaged 21 minutes on Wednesday (predicted 13) which pushed crowds higher at Epcot. Our predictions for Mission: Space (24 minutes, predicted 22), Soarin’ (64 minutes, predicted 68) and Test Track (70 minutes, predicted 72) were all accurate though. |
| Epcot |
4
|
7
|
|
| Hollywood Studios |
6
|
7
|
|
| Animal Kingdom |
7
|
7
|
|
| WHAT WE THOUGHT |
WHAT WE SAW |
ANALYSIS | |
| Magic Kingdom |
7
|
7
|
Crowds settled down on Thursday with all parks within one of predicted levels. Magic Kingdom hosted Extra Magic Hour morning but only Space Mountain averaged a posted wait higher than 60 minutes, at 66 (predicted 53). |
| Epcot |
4
|
4
|
|
| Hollywood Studios |
6
|
7
|
|
| Animal Kingdom |
5
|
4
|
|
| WHAT WE THOUGHT |
WHAT WE SAW |
ANALYSIS | |
| Magic Kingdom |
7
|
7
|
Slightly higher crowds at Epcot and The Studios again on Friday although resort wide the crowd level was a ‘7’ as predicted. The average posted time at Spaceship Earth was 24 minutes, double our prediction of 12 minutes. That is as high an average at Spaceship Earth as we have seen all summer. |
| Epcot |
5
|
7
|
|
| Hollywood Studios |
6
|
8
|
|
| Animal Kingdom |
5
|
4
|
|
| WHAT WE THOUGHT |
WHAT WE SAW |
ANALYSIS | |
| Magic Kingdom |
6
|
6
|
Resort wide crowds were a six again on Saturday despite higher crowds again at Epcot. Spaceship Earth went two minutes higher reaching an average of 26 minutes! All other predictions on Saturday were spot on. |
| Epcot |
4
|
7
|
|
| Hollywood Studios |
7
|
7
|
|
| Animal Kingdom |
5
|
5
|
|
| August 17 to 23, 2014 |
|---|
Summer crowds will begin to fade as we enter the fall season, the lowest crowds of the year. Wait times will still be high for popular attractions this week but with a proper touring plan crowds will be manageable.
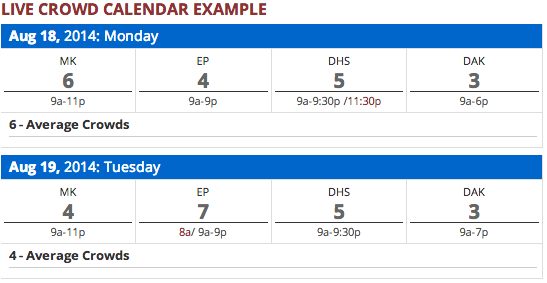
To see Walt Disney World Crowd predictions for the days of your vacation, check the Crowd Calendar.![]()
To get details about our predictions of future crowds or details about crowds in the past check out the Crowd Calendar and select “Jump to Date” on the left margin.
You May Also Like...
-

This weekend will have the longest park hours since Walt Disney World re-opened in July. Extended park hours are a signal…
-
The April Crowd Calendar update only has minor changes. We are halfway through spring break, and crowd levels have been in-line…
-
Crowded theme parks during the Christmas holiday are as certain as death and taxes. Every year we see crowd levels hit…
-
Since October 1 we have collected over 164,000 wait times across the four Disney World parks. Overall the average posted wait…
We’re going on the 31st, Labor Day Sunday. Hope it’s not too busy like yesterday (predicted 4, got 7)