Magic Kingdom Intermezzo
We’re still working on analyzing wait times at the Magic Kingdom, to finish the What’s Up with Wait Times series we started last week. We’re waiting to hear back from a few folks on a couple of questions related to those. We’re also waiting to hear if Disney says anything on their earnings call on Thursday. Once all that’s done, we should have the post up – probably Friday.
In the meantime, here are a couple of interesting charts. The first one is wait times and people in line at the Magic Kingdom from January through August, 2015:
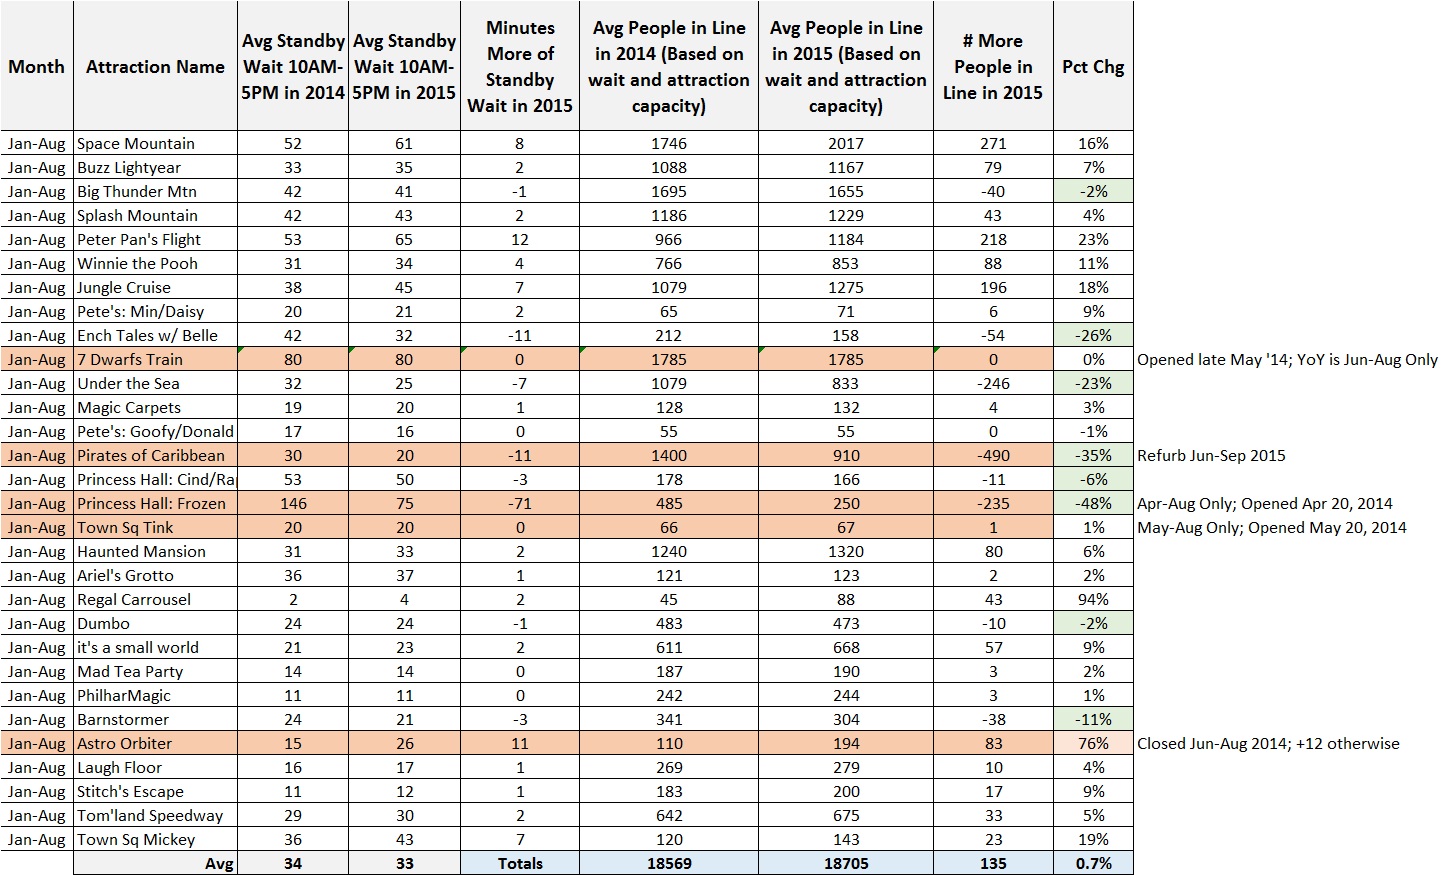
Orange lines are for attractions that either opened or had major refurbishments in 2014 or 2015.
Green boxes indicate attractions that became less popular in 2015. Excluding Pirates (which was refurb’d), what do those attractions have in common?
For what it’s worth, I think Magic Kingdom attendance was probably up more than 0.7% in January through August 2015 – probably closer to 1.5 to 2.0%. As we’ve said in previous posts, there are side effects to how Disney posts its wait times in 5-minute increments, and that’s probably causing most of the difference.
Now compare those wait times and people in line to September and October 2015:
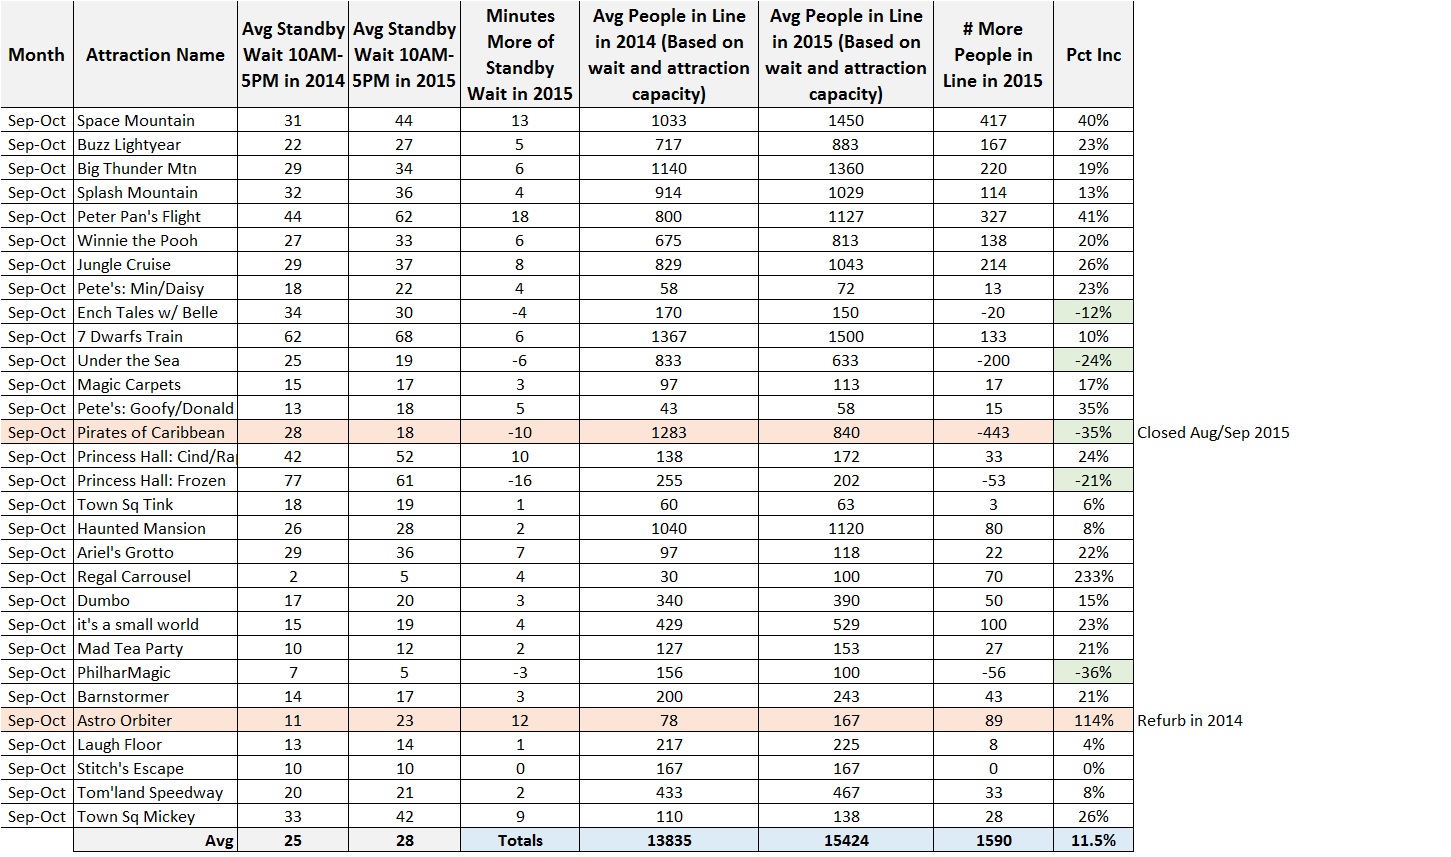
That’s an almost 12% increase in people in line, in what are normally two of the slowest months of the year. We’ve not seen anything like that in a long time – we’re off the edge of the map here [1]. As far as we can tell, crowds are up on days with and without Halloween parties; with morning EMH and without; and with evening EMH and without.
I don’t think this is related to more FastPass+ use, or better understanding of the system. In both of those cases, you’d expect to see a gradual increase over the course of many months: first a small group of early adopters figures it out, then a few more, then a few more after that, and so on, until most people understand how it works. What we’re seeing here is more like an on/off switch being flipped.
It’s possible that Disney’s Decision Science group – the people who do hotel revenue optimization – just knocked it out of the park this fall [2]. The earnings call might shed some light on that. The people we’ve spoken to inside Disney do seem to think it’s more people, not an operational change. If so, that’s a huge gain. Like I said, we’re asking around. If we need to go back and look at the other parks for September and October, we’ll do that too.
Also notice that a certain set of attractions is still losing riders year-over-year, even when others are way up. We thought Seven Dwarfs would have carried those attractions a little longer – most of them are within spitting distance of 7DMT.
Miscellaneous
A few folks have asked to see our FastPass and wait-time charts with different statistics.
- Here are the charts using median standby wait time and median FastPass availability. You’d use median instead of average if you want to ignore the possible influence of outliers. (We had already filtered for outliers in the original charts, too.)
- Here are the charts without considering day-of FastPass availability. This is good if you want to filter out the possibility of families dropping FastPasses at the last minute for something else, as that may change the “last available FastPass” statistic.
Footnotes
[1] I’m paraphrasing Captain Hector Barbossa in Curse of the Black Pearl, as I do often.
[2] Check out Google Scholar for some of the technical papers that Disney’s Decision Science team puts out. Some interesting stuff on hotel room inventory management.
You May Also Like...
-

Sometimes it is fun to just take it all in while you're at Walt Disney World. Recently, we spent an afternoon…
-

It's always a magical time when we visit Magic Kingdom. This weekend, our team arrived early to enjoy a morning at…
-

One of the most popular special activities that people take advantage when visiting Walt Disney World is the Disney Early Morning…
-

Cooler weather has arrived in Florida, and that means it is time for fall decorations at Magic Kingdom. (Yes, technically "cooler"…
We are using touring plans for our Nov. 13-21 trip, of course, but with all the talk of crowds when will it be okay for me to finalize my touring plans?
Disney required the purchase of either park hoppers or water parks and more with the free dining promo – is it possible that that is having an effect on lines? My guess is that a lot of free dining families may not have been getting a park hopper previously – it adds up quickly! But when it’s required, they may be more willing to split a day between AK and MK instead of spending the balance of the day at Disney Springs or the resort.
This is my thinking as well. We typically go in Sept, and go to MK on party days to avoid the crowds. This September, the party days seemed to be just as busy as the non-party days. And I began to formulate the same theory you have. All those free dining guests were forced to buy park hoppers and now were able to go to MK on party days, and then head to another park in the evening.
Len, thanks for all the awesome analysis! I love this stuff. Just an idea – I think you are saying EPCOT, Studios and AK are just up a little (1-2%) and looks like MK could be up 12%. Could it be that WDW as a whole is up 3-4% (a large amount, but not out of the park) and because of the closures etc. at other parks the bulk of the increase is going to MK?
I mean, the MK is a lot more popular than other parks. I don’t know why MK would be up 12% in Sept/Oct and the other parks not.
That said, we did ask Disney whether these wait times were caused by operational changes. They said no to the operational changes, and thought it was definitely higher attendance, possibly due to New Fantasyland.
“New Fantasyland” is kind of a stretch for me to believe. But when we ask these questions, we don’t get to ask them directly. They go through a few layers of people going in and coming back, so there’s possibly something lost in translation there. They definitely think it’s attendance, though, from what I got back.
Thanks for sharing the reports Len! I’m noticing a trend on the Fastpass+ – Reservation last found report…with the exception of the headliners, many rides show a substantial drop in FP+ wait times (i.e. they appear to be *more* available) around the end of June/early July this year. What happened then? Were more FP+ reservations allowed into the system thus making them more immediately available?
We’re seeing the same thing, Josh. Steve’s theory is that Disney was flooding the FP market for non-headliner attractions, to keep people happy. We just started looking at this, though, so haven’t had time to study in depth. Let me know if you see something we should look at.
I’m still not sure how any of these numbers help me plan my vacation coming up in February. The MK numbers suggest that in the first 8 months of 2015, the average standby wait time decreased by 2 minutes, yet the average number of people in line increased by 135 people compared to the first 8 months of 2014. On the other hand, an increase of 3 minutes in the average wait time from Sept/Oct 2014 to Sept/Oct 2015 suggests 1590 more people in line. I understand that the difference may come from which lines people were in, but does a 2 or 3 minute increase in average wait time really mean that your crowd calendar will predict a 3 and see an actual 7 or 10? If that is the case, it’s useless. I recall a post where you said you saw a 10 in October one day at MK. Are you saying that it is the most crowded day you have ever seen, as crowded as NEw Years Eve? I was not there in October but have been on NYE and seriously doubt MK was that crowded. I was there over Labor Day weekend. I walked on to several rides showing 10-15 minute waits running with empty seats. Space Mountain was loading only one side for a while (so not maximum capacity). Your site has plenty of useful tools and information. Unfortunately, your wait times centric Crowd Predicting calculator is not one of them. If I am reading your charts correctly, a 30 minute wait for some rides can be indicative of anything from a crowd 3 to a crowd 7. Sorry, that tells me nothing. I paid my subscription fee to plan future trips. This does not help me do so.
Hey James – thanks for the feedback. You’ve brought up a lot of points. I’m on a train now, but will respond within 24 hours. In the meantime, let me know if there’s anything I can do for your February trip: len@touringplans.com.
Len,
Do you really believe Decision Science could move the numbers 10 to 12% year over year? Did they get that much smarter? It is hard to believe the hotels are that much busier. Is there that much spare vacancy in September and October? That would be more out of the chart room than just off the edge of the map. If the DS team pulled that off I guess Santa will have something a little extra special in their Christmas stockings.
It would be amazing, wouldn’t it? But we have enough interesting hotel occupancy data for October that we need to ask them that specific question.
This could make modeling for the Crowd Calendar very interesting. Do you project the same level of genius going forward or did they just hit a sweet spot with the wind at their back that will not be reproduced. I am glad you guys are better at math than I am. Thanks for all the hard work.
I have heard you discuss the balking (spelling?) limit for lines. ie someone would wait 50 minutes to see a princess, but not 60.
As the lines grow throughout the park, does this balking point push lines away and move them around in any meaningful way. With Frozen m&g down to 60 ish minutes, would people be more likely to stand in that line, than those who would have seen last years 170 minutes and pass by. For example, might that line have dropped more than the 48 or 21% rates you listed, but since the line is shorter and more appealing people who would have skipped it all together are filling in the line, propping up its numbers.
And even if that is true, would it have any statistical difference in the rest of the park.
Yep, it’s spelled “balking.”
That’s an interesting idea, Kevin. Yeah, that might be happening. There are certainly people who would not wait in a 170-minute line, but who *will* wait in a 60-minute line. And those people keep the 60-minute line from becoming a 50-minute line.
Let me ask Fred and Steve about this. If we need to address it, we will. Thanks for that idea.
I am surprised at the drop in Anna and Elsa wait times. I was certain it would go down at some point, but it was a fairly large drop. 48% over the year and 21% over the last few months. While I doubt that alone made any difference, I wonder what that drop would do to the FP+ distribution numbers. It was likely drawing a significant number of the 3 pre-planned FP+’s, with little or no same day availability.
So, if that is true, then more fastpasses would have gone to other rides, and thus reducing standby capacity, maybe… and therefor increasing the lines. It also seems a little interesting that the drops were all in what would be considered the kiddie level rides/attractions.
Fastpass + reservation last found = brain meltdown
I think I understand … if there is a dot around the 15 minute mark that means 15 minutes before closing time? So basically you could get a fastpass for that ride throughout the day?
Also – What is that bump between 5/2 and 6/28 for reservation last found in 2015? Does that indicate fewer fp+ being distributed?
Thanks for sharing!!!!!!!!
Hey Jaymie!
The FP line represents how far in advance the FastPasses ran out, for any ride time you wanted between 10 AM and 5 PM.
Let’s say the dot is at the 15-minute mark. That means that on average, you could get a FastPass for a ride between 10 AM and 5 PM, for 15 minutes from “now”.
So if you were at a FastPass kiosk at noon, and wanted to ride, say, Living with the Land, then on average, there’d be one available with a start time of 12:15 PM.
If the dot is at the 1-day mark, it means you had to ask for a FastPass reservation yesterday, for today.
I wonder if Annual Pass use has increased. There may be people who have decided they will not renew due to changes in the cost. Those people might be trying to get in their last hurrah.
After looking at your list of rides that have lost riders each year, I wonder if the age of the guests in 2015 is higher? Do you have access to the percent of tickets that are sold for the under 10 – child ticket demographic vs the adult ticket demographic? I know as my own children have gotten older we still hit all the attractions at least once but for several attractions such as “Enchanted Tales with Belle”, once is enough for our week long visit. When they were younger we would have visited it several times during our stay. Older kids can get up for rope drop, not nap, and stay until close, therefore spending more time in a park than a family with a 3yr old would. So in the case of my family, we are still only 5 people but we will spend more time in the parks now than we did 2 or 3 years ago. So these same 5 people are increasing ride wait times by spending more time in the park. We also move from attraction to attraction more quickly and take less bathroom breaks, don’t have to go find the stroller, etc so a larger percent of our time with older kids is dedicated to attractions than it would have been when they were youger. If the percent of guests in the older demographic has increased significantly, could that skew the wait times or is that already taken into consideration in your models?
I assume party season (first Halloween and then Xmas) is designed to boost revenue during what is a quiet season. As a result, 4 times a week MK closes early. If MK closes early 4 times a week, the available capacity of the rides at MK throughout a typical vacation is reduced (which is fine when fall is the slow season). There were 18 parties for Halloween in October at MK this year. Last year 16 of 31 days, the year before 15 of 31 days and then previous years either 15 or 16. The more parties they have the more ride capacity is reduced through early closure.
Then, if fall is no longer slow season and crowds are going up in September through November, the reduced operational hours arising from the parties will continue to severely limit capacity. With more parties this year than ever before, surely that must have had some impact. If fall attendance continues to ride, there is no way out of this unless there is a reduction in the number of parties to open up additional ride capacity.
Here’s my crackpot theory:
The elimination of non-expiring tickets could be a factor. My family used to buy 10 day non-expiring Park Hoppers. We always just felt like we had credits, in a sense — we might be using tickets that were paid for several years previously.
Now with only expiring passes, it feels like a more direct expense. And thus people might want to get the most bang for their buck, especially when they are absorbing that cost very close to their visit. And while it will always cost more to attend more days, the per day cost savings from 3 days to 4 or 5 days is substantial. Do you think it’s possible people are just staying longer in order to justify or maximize the value of the tickets?
I know it’s a little bit of a stretch but if people who are already planning for 3 days discover that they can pay $30 more for one more day in the parks or $40 for two more days, that might explain the increase in attendance. Obviously such guests still need to stay somewhere and have the time to attend, but trying to stretch the value of their tickets seems at least plausible to me. Thoughts?
We too were buying 10 day non-exp tickets and using them over 2-3 trips from Tennessee. If we’re buying 4-5 day base MYW tickets then yes we’ll feel forced to go extra days to get our money’s worth. Not sure our budget can take that, we’ll definitely be looking at staying at cheaper off-site hotels or renting a house.
Agreed- doing exactly the same thing!
Interesting point. Let me see what we can look at there. Sometimes those outages aren’t reported. Good idea though. Thanks!
Do these charts take temporary closures into account for wait times? Just anecdotally, I walked past Peter Pan maybe 5 times over 3 days last week, and the ride was down 2 of them with standby wait times higher than I expected the other 3 times. The longer wait times may be the result of closures (e.g., we used our FP+ at a time later in the day due to the ride being closed during our original window) and could just show the same amount of people in line during fewer hours of operation rather than just more people in line total. That would, of course, only be relevant if you knew whether rides had significant differences in down time in one year compared to the other.
I thought I remembered that in an early discussion of this issue, it was shown that overall attendance at WDW is not up significantly. If so, well, there’s only so many places people can be, right?
– In their resort/hotel
– In a restaurant
– On or in line for an attraction
– Somewhere in transit (between attractions, to/from parks, etc)
Len, is there any data that indicates that fewer people are hanging out at the resorts or in restaurants? Maybe there was an improvement to the transit system that has more people in the park and fewer en route (more buses, faster monorail, etc)?
Before September, I would have said attendance was up across WDW maybe 2%. But let’s see what Disney says about September and October.
Some of the places I’ve noticed that I’m having to wait more often than before — restrooms, drink carts (as in water/soda, not beer!), and cash registers in stores. And while the latter two might be a case of people spending more money, the first one hints to me that there are more people in the parks. I’ve also noticed that if I arrive at a park by car at the same time as I did last year, I’m a row or two farther out than before. Both Epcot and MK have had parking lot capacity issues this year (and I live in terror that I’ll end up in one of the MK parallel parking zones).
So yeah, I think it is a given that there are more people. And not all of them are staying on property. Horizon West (the new 23,000-acre planning area of developments right next to WDW in Orange County) is absolutely booming, and filled with people with plenty of disposable income (median income of $68K, which is “healthy” for metro Orlando), many of whom are Disney fans. In 2000, the population of Horizon West was 750. In 2005, the population was 4,222. In 2006, the population was 6,695. This year, the population is predicted to be 24,105. By 2030, the population is predicted to be 50,221. Many of the people in this area make at least weekly trips to WDW, and some more often, plus they bring friends and family who come to visit along with them. Those kind of numbers certainly are a drop in the bucket for theme park attendance, but enough drops can make a bucket fill faster.
Hmmmmm. How long till we see a bathroom add on to the lines app?
I think the “more people” is specifically “more annual passers” or annual passers who visit more. I think it is the reason Disney rejiggered their APs this year, not just upping the cost by 5%, but starting to re imagine how they get used. This theory helps explain why the parks are so full without such a substantial increase in line times- APers are less concerned about riding every ride every day.
I know someone who went to WDW recently, made FastPass+ reservations, and then did not use all of them.
This person has a daughter who is about 5 years old. They had a FP+ for Toy Story Midway Mania for 3 PM (or something like that). As they were walking by TSMM on the way to something, the daughter decided she wanted to ride it. The posted standby wait was 90 minutes or similar. Rather than wait 2 hours to ride with the FP+, they got in line, and waited the hour and a half to ride. Then, they went back to the hotel, because everyone was tired. So the FastPass+ went to waste.
This is apropos of nothing, except to ask, have you considered the possibility that the people in these crowds you’ve been seeing lately have had their brains addled by the heat, and are acting irrationally?
Having actually been in the parks this fall, we can tell you. It’s more people. Way more actual bodies in the parks. Perhaps it’s time to figure out a crowd calendar that predicts actual crowds as opposed to ride wait times (which are, of course, two very different things). A great case in point was the first two Saturdays of F&W at Epcot this year. Both days so slammed with people it was hard to walk in the park, let alone get to a booth for food. However, the current “crowd” calendar gave a 3 (which was upgraded to a 6 after the fact) and a 6 which stayed a 6 after the fact.
MK, AK, and DHS also had more people than we would have expected given the predictions.