
Disneyland Crowd Calendar Update
Wait times are up at Disneyland Resort in California, and it is time to calibrate and update the Disneyland Crowd Calendar. Over the past twelve months the average crowd level at Disneyland was between 6.5 and 7.5 on our scale. We would like that average to be between ‘5’ and ‘6’. In addition, the crowd calendar needs to periodically adjust to the changing forecasts for wait times at the attractions. The forecasts use hundreds of factors to determine what the wait time is likely to be at any given date and time and since many of those factors change periodically, so must the Crowd Calendar. School calendars, events, park hours, annual passholder blockouts, single-day ticket prices, holiday schedules and attraction refurbishments are some of the many factors that influence wait times.
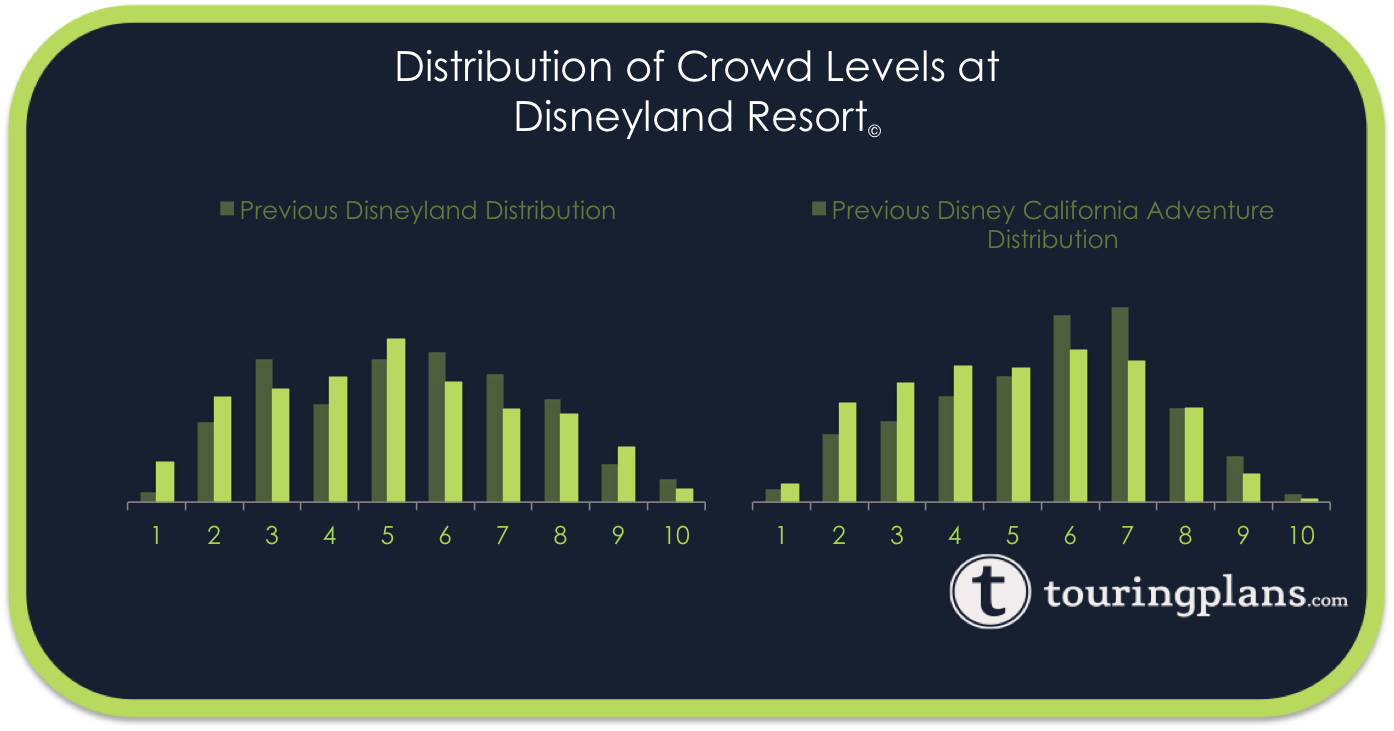
Today the latest Disneyland Crowd Calendar numbers appear on the Crowd Calendar page. The new figures represent a three month long examination of what affects wait times at each of Disneyland Resort’s attractions. The result will be a shift in the overall distribution of crowd levels on our scale. This means that a change in crowd level for a particular day doesn’t necessarily mean that the day will have different wait times that what we predicted before, although it can mean that too. Think of it like fixing a dollar amount based on the value of a dollar in a given year. You may have read articles that use “based on 2012 dollars”, to compare prices over time, for example. Well, the Disneyland Crowd Calendar is now using 2016 wait times as a fixed reference point.
Disneyland Park is up more than Disney California Adventure. Based on the previous scale, Disneyland has averaged a crowd level of 7.6 over the past 10 months while Disney California Adventure is around 6.3. We are seeing more crowd levels at ‘7’ or higher than we are seeing at ‘3’ or lower. Although that represents the nature of crowds at Disneyland Resort this year it makes the Crowd Calendar less useful if we keep that scale for future years. In the extreme case, if we never changed the crowd calendar scale then 2017 dates would be filled with only ‘8’s, ‘9’s and ’10’s.
Let’s take a week-by-week look at the Disneyland Crowd Calendar from now through the next twelve months. Notice that a lot of the changes are drops in crowd level at Disney California Adventure. After a billion dollar expansion in 2012 it appears that the novelty may finally be fading.
October 31 – November 6, 2016
The week of Halloween will see a small drop on some days but nothing more than two index points. Most days will remain the same as this week tends to be light crowds across the resort. Some week days earlier this fall showed crowds much larger than usual but we expect that to be an anomaly and predict that crowds will be moderate into November as usual.
November 7 – 13, 2016
The crowd levels on Veterans Day get a bump up to a level ‘7’ at both parks while the day after drops to a ‘4’ at Disney California Adventure. The net effect for the week is similar crowd levels to what we previously predicted.
November 14 – 20, 2016
No significant changes during this week.
November 21 – 27, 2016
Only minor changes to report for Thanksgiving week except for a three point drop at Disney California Adventure on the 26th. Earlier in the week DCA did see a bump of a couple points on some days.
November 28 – December 4, 2016
Crowd levels have dropped or stayed the same during the last week of November. The drops are mostly at Disney California Adventure although December 1 did see a two point drop at Disneyland Park.
December 5 – 11, 2016
More minor drops to report during the first full week of December, especially at Disney California Adventure. These drops are indicative of the re-distribution of our crowd calendar scale. Days that used to be ‘5’s and ‘6’s are now ‘3’s and ‘4’s.
December 12 – 18, 2016
The second week of December brings our first major changes with this update. Crowds at Disney California Adventure are now predicted to be much lower based on this new scale. It is unlikely that the ‘7’s and ‘8’s previously predicted at the middle of this week will be reached. The ‘4’s and ‘5’s now appearing are much more likely given the new distribution.
December 19 – 25, 2016
Disneyland Park remains very similar to what was on the calendar during the week leading up to Christmas Day. Disney California Adventure sees some jumps of two index points mixed in with a drop by three points on Christmas Eve.
December 26 – January 1, 2016
The busiest week of the year remains so after this update. In fact, Disney California Adventure sees an increase to match the peak crowds at Disneyland Park. New Year’s Eve and New Year’s Day continue to be the least crowded days to visit Disney California Adventure during the Christmas Season.
January 2 – 8, 2017
Small changes will appear on the calendar during the first week of January, mostly at Disney California Adventure.
January 9 – 15, 2017
Early January crowds will now be at the low end of our scale as we begin 2017, except for the weekend where we will predict some ‘7’s and ‘8’s for Star Wars Weekends.
January 16 – 22, 2017
We like our crowd distribution to include a portion of days at the level ‘1’ and for this week we see many days like that at Disneyland Park. It doesn’t necessarily mean that the park will be empty, it just means that wait times will be as low as they are likely to get in 2017.
January 23 – 29, 2017
We see more drops from ‘5’s and ‘4’s to ‘2’s and ‘1’s during the last week of January. It looks like any day but Saturday should be a good day to visit with minimal crowds.
January 30 – February 5, 2017
More of the same during the last week of January, with one or two point drops in crowd level across the board. Super bowl sunday arrives on February 5.
February 6 – 12, 2017
Now that we have all of the school calendar information and schedules for February we can confidently say that crowds will be much lower than originally predicted between February 6 and 12, 2017. However, remember that this is partly due to the shift in our scale.
February 13 – 19, 2017
By mid-February we see similar crowd levels to what was previously predicted. Some crowd levels have dropped but mostly the same or one point differences this week. Presidents Day will bring a busy weekend of crowds as usual.
February 20 – 26, 2017
Minor changes only
February 27 – March 5, 2017
Disneyland goes up a point and Disney California Adventure goes down a point, most days during the first week of March.
March 6 – 12, 2017
Once again Disney California Adventure skews downward while Disneyland Park remains relatively unchanged.
March 13 – 19, 2017
Both parks see an increase in crowd level of one to two points during this week. Crowd levels this week were impacted by up-to-date school calendars which show fewer schools in session than previously predicted.
March 20 – 26, 2017
Crowd levels at both parks see a one or two point jump most days again this week.
March 27 – April 2, 2017
Relatively minor changes during the last week of March.
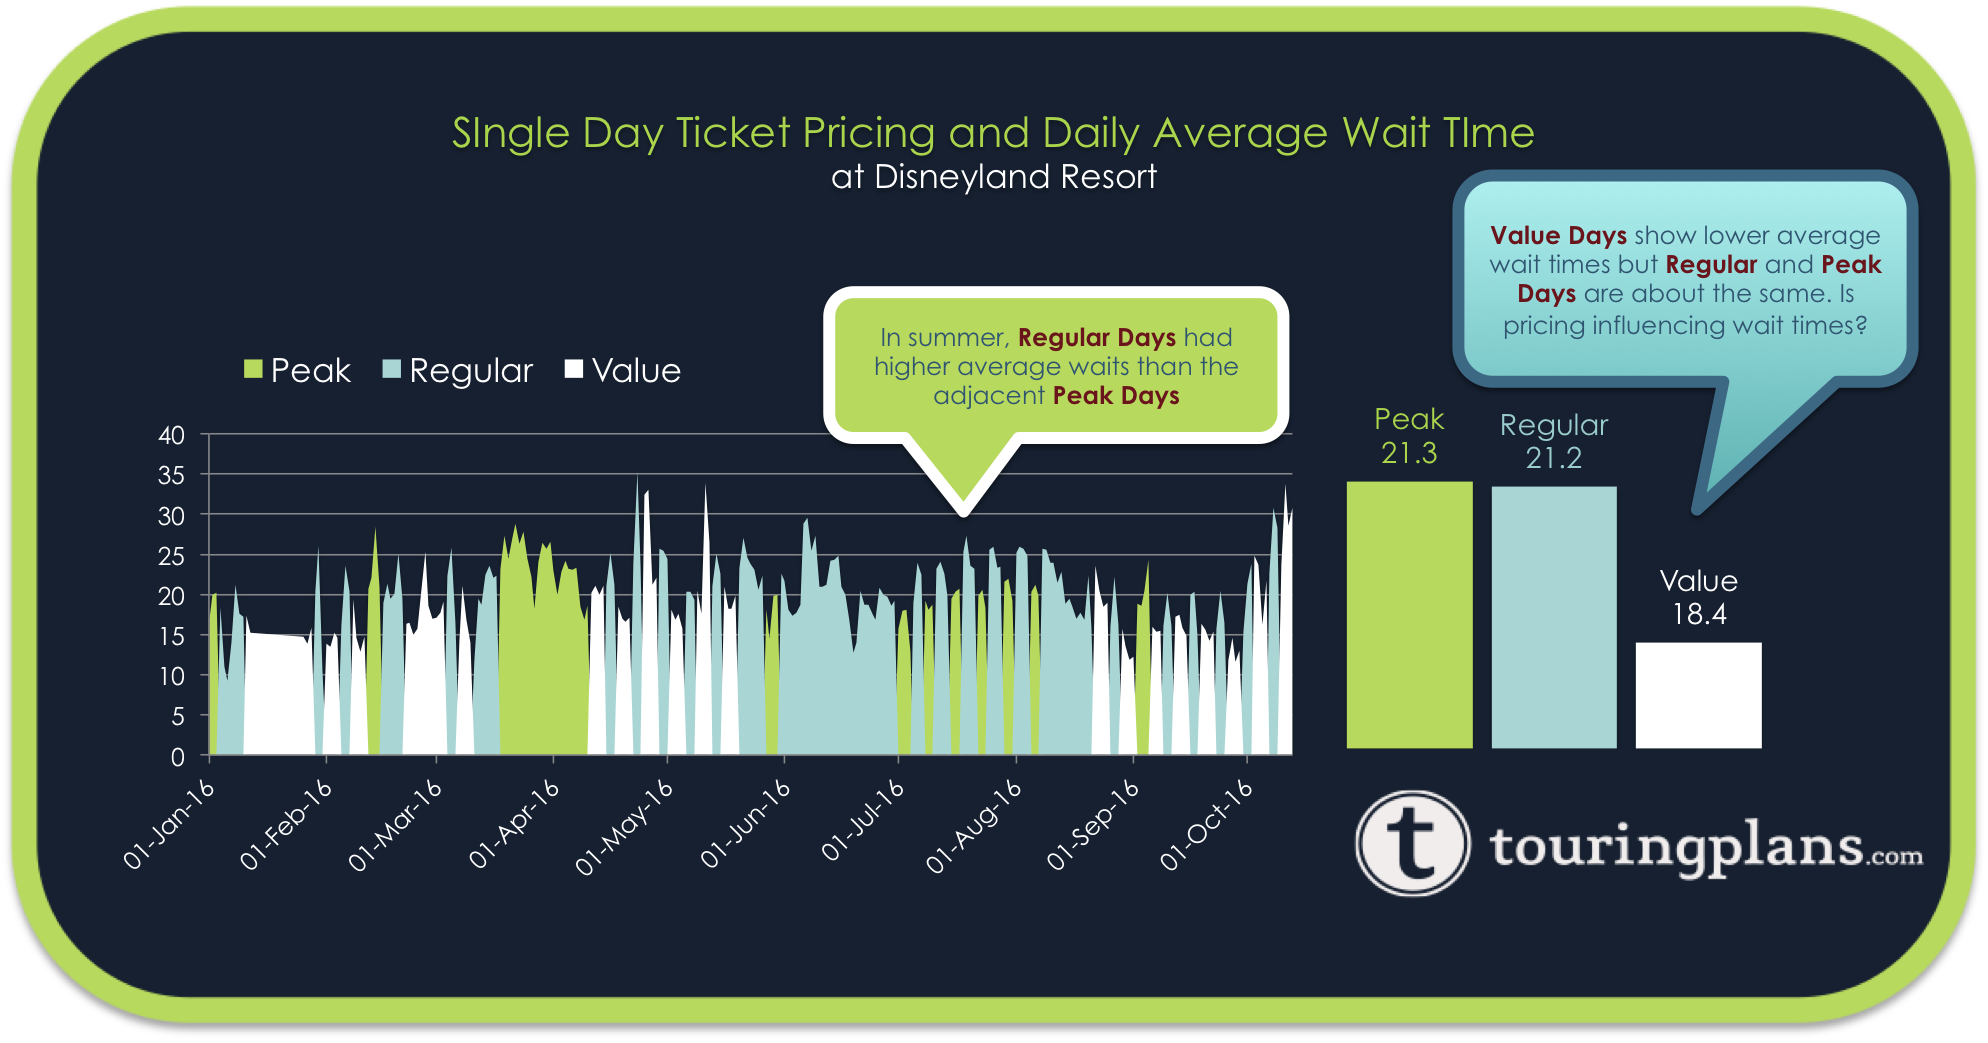
As we look into April 2017 we enter dates when the single day ticket price is unknown. Although this isn’t the only indicator for the expected crowds (far from it), it does play a role in the crowd levels we expect. We can make an educated guess of what the ticket season will be but note that once it is officially announced, these crowd levels may be updated again.
April 3 – 9, 2017
This is the second week on the calendar when we see major changes to the index levels. More schools have a break this week than projected during the last update of the calendar. What were ‘4’s, ‘5’s and ‘6’s are now ‘6’s, ‘7’s and ‘8’s.
April 10 – 16, 2017
Crowd levels during the second week of April were already at the top end of our scale, they remain within one point as a result of this update. Easter Sunday falls on April 16 and large crowds will visit both parks.
April 17 – 23, 2017
The ‘7’s and ‘8’s on the calendar are now increasing to ‘8’s and ‘9’s after this recent update, except for some days at Disney California Adventure that drop by a point.
April 24 – 30, 2017
Now that we have up-to-date school schedules, wait time predictions for the last week of April have gone up significantly enough to push crowd levels two to four points higher at both parks.
May 1 – 7, 2017
The first week of May brings some increases in crowd level at both parks. Most days see an increase of one or two crowd levels.
May 8 – 14, 2017
Minor increases to the crowd levels at Disneyland Park with slightly more significant increases at Disney California Adventure.
May 15 – 21, 2017
We see a mixed bag of changes this week. Some go up, some go down, but none significantly so except for Saturday when both parks are now bumped up to an ‘8’.
May 22 – 28, 2017
We see a couple four point increases at Disney California Adventure this week to bring that park in line with what is expected at Disneyland Park. However, most dates are within one point of what was previously predicted.
As we look further into 2017 we get further away from when the forecasts were made and the likelihood that the crowd levels will be updated again goes up. Before May and June 2017 arrives we will have better information about park hours during the summer and travel trends in the spring that may affect our projections for the summer crowds at Disneyland Resort.
May 29 – June 4, 2017
More increases at both parks during the last week of May and the first week of June but most were within a couple points of what was previously predicted.
June 5 – 11, 2017
Disneyland Park crowd estimates remain very similar during the second week of June while Disney California Adventure shows some slight increases on some days. Crowds peak on the weekend as Southern California passholders take advantage of their last unblocked days before summer.
June 12 – 18, 2017
Relatively minor changes during mid-June at both parks.
June 19 – 25, 2017
Overall we see a drop in crowd levels this week although some days did increase a bit.
June 26 – July 2, 2017
Disney California Adventure sees major drops in crowd level during the last week of June while Disneyland remains relatively unchanged.
July 3 – 9, 2017
Crowds during the week of Independence Day in 2016 were busy but not at the top end of our scale. Since July 4th falls on a Tuesday in 2017 the calendar is predicting that the parks will be very busy starting on Saturday, July 1.
July 10 – 16, 2017
For the week after Independence Day this update shows crowds at or above what was predicted, mostly thanks to the D23 convention held that weekend.
July 17 – 23, 2017
Mostly downward adjustments appear during this week in mid-July and most of those are attributed to Disney California Adventure. Disneyland Park remains relatively unchanged.
July 24 – 30, 2017
Crowds were predicted to be busy during the last week in July and that is still the case although the numbers did drop on some days.
August crowds may be adjusted once we have complete information about the school schedules for the 2017-2018 school session.
July 31 – August 6, 2017
Once again most changes occurred at Disney California Adventure with jumps of one to two index points during this week while Disneyland Park stays the same during the first part of the week then lower crowds as we head into the weekend.
August 7 – 13, 2017
Changes in August are subtle but driven mostly but up-to-date school schedules. Nothing major at Disneyland Park during the second week in August.
August 14 – 20, 2017
The third week of August is going to be much less crowded than previously expected, if 2017 is anything like 2016. This update shows a lot of ‘3’s and ‘4’s at the parks that week, down from ‘6’s, ‘7’s and ‘8’s.
August 21 – 27, 2017
More lower crowds appear on the latest crowd calendar update for the end of August.
August 28 – September 3, 2017
The latest distribution shift has identified late August as the ‘1’s and ‘2’s on our crowd scale. If you want to visit Disneyland during the time of year with the lowest crowds it is hard to imagine lower crowds than what we will see next August and September.
September 4 – 10, 2017
We see lower crowd predictions for Disney California Adventure in the second week of September as well while Disneyland Park remains relatively unchanged.
September 11 – 17, 2017
Minor changes only at both parks.
September 18 – 24, 2017
Minor changes again at both parks.
September 25 – October 1, 2017
Slight increases at the parks at the end of the week, unchanged otherwise.
October 2 – 8, 2017
Minor changes of one or two points most days but nothing major at either park.
October 9 – 15, 2017
Mostly minor changes for mid October next year, remembering that these predictions are very far in advance and therefore likely to change.
October 16 – 22, 2017
Some two-point jumps appear this week in 2017 which are most likely a reaction to the bumps in attendance we saw this year during the same week.
October 23 – 30, 2017
Overall this week has dropped compared to what was previously predicted.
We humbly remind those who use the Crowd Calendar that it is a statistical tool that is subject to change as the travel patterns around the Disneyland Resort change. Dates further into the future are more likely to change as we continue to gather information on a daily basis from the parks. We recommend you use the calendar in cooperation with a custom touring plan to minimize your wait in line.
You May Also Like...
-

July is here and the Disneyland Crowd Calendar needs an update. A big update. Star Wars: Galaxy's Edge is open to…
-
The final month have summer has begun and it is time for a Disneyland Crowd Calendar update. We have two months…
-
Everyone's number one priority right now is to help slow the spread of COVID-19 by practicing social distancing. Disney did their…
-
It is time for an update to the Disneyland Resort Crowd Calendar. Crowds Since Galaxy's Edge Opened Crowd levels have been…
Just to make sure I understand, the attraction wait time scale you use to gauge attendance is what has been changed, correct? So for example, maybe a wait of 40-45 minutes at space mountain was previously a 5 and is now a 4…something to that effect? If that is the case, have your numbers on the page where you show estimated wait times for each crowd level been updated? Thanks!
Did I miss the crowd calendar report for Augusr, September, and October? I’d like to know the actual crowd versus what was expected.