
Disneyland Crowd Calendar Updates
The weather in Southern California is wreaking havoc on crowd patterns at Disneyland Resort. Rain has been so heavy in the first quarter of 2017 that the parks have closed early on some days. The effect on crowds is significant because is reduces the crowds on the poor weather days but creates a big, disproportionate bounce-back effect when the sun comes out. So, it is time to update the Disneyland Crowd Calendar.
Hidden under all the volatility due to weather is an overall increase in wait times. The increase has been evident in recent months, especially at Disneyland Park.
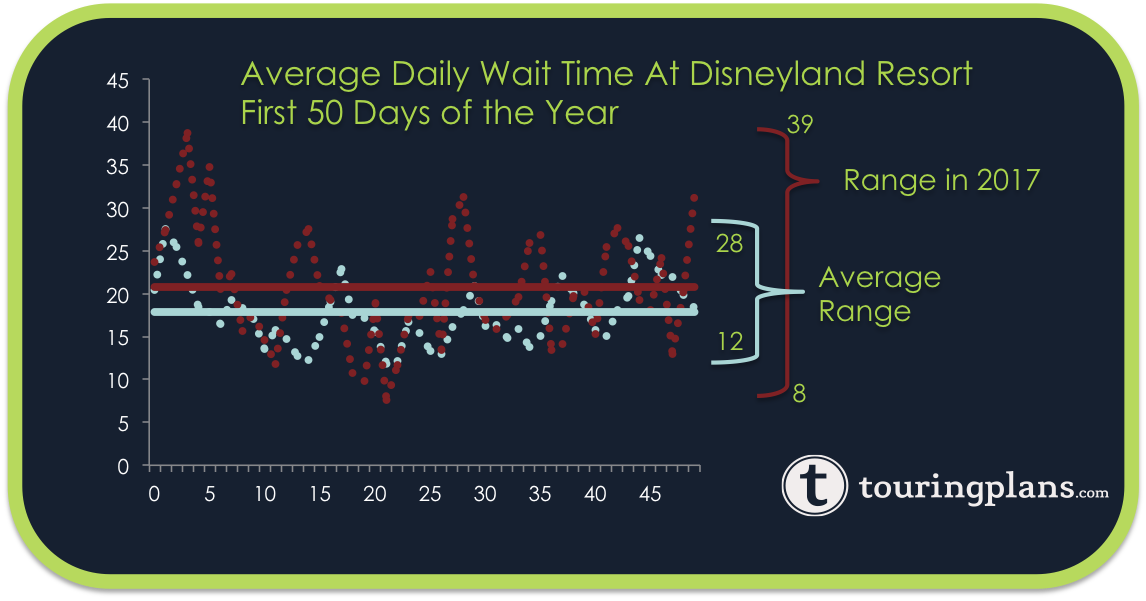
Here is a look at the first 50 days of 2017 compared to what we usually see at Disneyland Resort. Wait times are significantly up but only on certain days. Overall the volatility (range of average daily wait times) is way up too. There are some recent signs that the crowds are returning to normal so we will be watching closely. In the meantime, these latest trends necessitate an update.
What Leads to Updates in the Disneyland Crowd Calendar?
Our crowd calendar models look at hundreds of factors when considering how busy Disneyland Resort will be on any day. Some factors are based on how the economy is doing – things like the U.S. unemployment rate, the Consumer Price Index, and so on. Other factors track the operating schedule. Of those, here’s a list of the things that change often and tend to influence the crowd calendar numbers:
- How many hours Disneyland is open on a given day
- The time of day Disneyland closes on a given day
- How many fireworks and evening shows Disneyland has scheduled on a given day
- The park’s overall ride capacity that is lost to scheduled refurbishments and closures on a given day
- The “ticket season” e.g., value, regular, or peak for that day
- Any special deals on tickets that are available for that day
It’s not surprising that Disneyland’s managers increase the park hours and entertainment available when their internal data show higher crowds. When you’re looking at the updates below, it’s safe to assume that any change over the next 60 days is influenced by a change in Disneyland’s operating schedule and Disney’s special ticket deals. (Disneyland hasn’t yet – thankfully – gone to dynamic day-of pricing.)
Crowd calendar changes to dates more than 90 days out are probably influenced by the ticket season and ticket deals. Disney only started using seasonal ticket pricing a little over a year ago, which means our models have only seen seasonal pricing’s influence on one spring break, one Easter, one summer, and so on. As we collect more information, those models will get better and the changes over time will get smaller. For now, though, it’s safe to say that we, Disney, and Disney theme park fans are all still trying to figure out how seasonal pricing factors in to the decision to visit a park.
Here is a month-by-month look at the updates.
March 2017 Disneyland Crowds
The only changes to report for March are minor ones. Crowd levels moved up by one or two points most days as a result of this update. That means the models are most likely reacting to slight variations in Park schedules and the recent trends that we have tracked since the beginning of 2017.
April 2017 Disneyland Crowds
April also sees increases to some days but usually only by a point. Easter is still predicted to be near the very top of our scale. Two days will see an increase of two points.
May 2017 Disneyland Crowds
More minor increase of a point or two to report for most of May except for the end of the month. May 27 to 31 will see some jumps or two points at Disneyland Park and some reductions at Disney California Adventure. We still expect crowds to be significant for Memorial Day weekend however, it is the busiest weekend of the month.
June 2017 Disneyland Crowds
June sees some significant changes in the early part of the month but otherwise June looks very similar to what was on the previous version of the calendar. The changes are a mix of increases and decreases as the model reacts to updated park hour schedules.
July 2017 Disneyland Crowds
Dates around the July 4th holiday will see similar crowd levels than what was previously predicted. Since it falls on a Tuesday we expect the weekend crowds to be slightly busier than the holiday itself. Guests visiting Disneyland Resort should expect significant crowds and very high waits times for the first 5 days of July.
August 2017 Disneyland Crowds
Nothing major to report for August. Some minor increases of one index point at Disneyland Park and some minor decreases of one index point at Disney California Adventure. Most days remain unchanged in August.
September 2017 Disneyland Crowds
September 16 will see a drop of two points at Disney California Adventure but that is the only change of more than one index point during the month. Most days remain unchanged in September as well, retaining its identity as the month with the lowest crowds at the resort.
October 2017 Disneyland Crowds
We do see some changes in October and those changes are increases in most cases. These increases are a reaction by our forecasting models to the wait times that we collected last October after the previous update to the crowd calendar. Many of the ‘5’s and ‘6’s previously forecasted for October will become ‘7’s and ‘8’s with this update. October is several months away however so you should expect that these forecasts for October and later may change before the month arrives.
November 2017 Disneyland Crowds
Veteran’s Day (November 11) falls on a Saturday this year and our crowd calendar forecasts are getting a bump on days around the holiday. Other than that we don’t see many changes to the calendar forecasts during November.
December 2017 Disneyland Crowds
No major changes to report for December either. The early part of the month is still an excellent time to visit the parks while the Christmas holiday season will be the busiest time of year at the resort. Disneyland is predicted to see ‘7’s and ‘8’s or higher every day once we reach the 18th of the month.
January 2018 Disneyland Crowds
January wait times from 2017 are in and analysis shows that early January was busier than usual while late January was less busy. Our models do not exclusively use the previous year’s wait time to predict crowds but we do give more weight to recent data. So, our forecasts for January have changed slightly as a result of this update.
February 2018 Disneyland Crowds
February 2018 sees no major changes on this update.
You May Also Like...
-

Everyone's number one priority right now is to help slow the spread of COVID-19 by practicing social distancing. Disney did their…
-
We have had a few weeks to observe the wait times at Universal Orlando Resort since the parks reopened in June.…
-

Our latest Universal Crowd Calendar update was incomplete. We have now updated the dates that were missed. For a description of…
-
July is here and the Disneyland Crowd Calendar needs an update. A big update. Star Wars: Galaxy's Edge is open to…
For Wdw, TouringPlan crowd estimates increased as I got closer to my March1-March 10 visit. When I was there, crowds were much greater,even greater than upward estimates, as shown by my observations and your “How we did”day-after revised crowd numbers. Using “How we did”data for Fla WDW could you do blog on analysis and theories on why WDW was so much more crowded recently than even your higher revised updates? Thank you. Bob
Thanks so much! We are going May 31 – June 3 and I appreciate getting the email updates, too. Looks like parts of our trip went up and parts went down, so overall a decent balance. Between Grad Nites and GoG opening I’m sure there will be fluctuations, but I so appreciate your info!!
Your crowd level predictions have been way, way off for AGES now. I don’t expect them to suddenly get more accurate any time soon.
Thanks so much!! I’ve been wondering what was up with DLR wait times. Hopefully things will be calm for our trip in May.
And speaking of GotG, when do you think the personalized touring plans app will be updated to have an actual wait time? Obviously it hasn’t opened yet, but it seems like it should be possible to estimate something more realistic than zero, even if just based on what Tower of Terror had?
Have you taken into account higher crowds in DCA after Gotg opens?
We think that Guardians of the Galaxy will see a significant surge when it opens but that medium to long term it will return to similar wait times that we saw for Tower of Terror. The Calendar is based on the average wait times between 10am and 5pm at a set of core DCA attractions so overall, a temporary surge at one attraction is not enough to affect the calendar numbers.
So is there a reason why the Personalized Plans app shows the wait time as “0” at this point (for dates well into the future, after it will presumably be open)?