Disney World Crowd Report – July 13 to 19, 2014
Summer-like crowds have arrived. We saw above average crowds most of last week including some higher wait times at The Studios than we have seen at that park in a while. Elsewhere, our predictions did very well, missing only once or twice.
Let’s look at how the crowd levels stacked up each day last week on the Disney World Crowd Report:
| WHAT WE THOUGHT |
WHAT WE SAW |
ANALYSIS | |
|---|---|---|---|
| Magic Kingdom |
5
|
5
|
Sunday’s crowds were surprisingly low at The Studios but as expected at the other three parks. Toy Story Mania’s averaged stayed below 70 minutes while Tower of Terror was only a 34 minute average posted wait. Guests at Star Tours experienced even lower waits, an average of 14 minutes. |
| Epcot |
4
|
3
|
|
| Hollywood Studios |
6
|
3
|
|
| Animal Kingdom |
5
|
5
|
|
| WHAT WE THOUGHT |
WHAT WE SAW |
ANALYSIS | |
| Magic Kingdom |
8
|
7
|
Conversely, Monday’s crowd at the Studios was higher than expected, the first time we have observed that since the spring. Toy Story Mania average posted time reached 83 minutes and Tower of Terror reached 59 minutes. Elsewhere, our predictions all did well with perhaps the exception of Space Mountain where the average posted time was 67 minutes (predicted 58). |
| Epcot |
6
|
6
|
|
| Hollywood Studios |
5
|
8
|
|
| Animal Kingdom |
7
|
7
|
|
| WHAT WE THOUGHT |
WHAT WE SAW |
ANALYSIS | |
| Magic Kingdom |
8
|
8
|
No problems with any predictions on Tuesday, we swept the board with only a slight miss at Animal Kingdom. Crowds grew significantly between Sunday and Tuesday. |
| Epcot |
8
|
8
|
|
| Hollywood Studios |
7
|
7
|
|
| Animal Kingdom |
8
|
9
|
|
| WHAT WE THOUGHT |
WHAT WE SAW |
ANALYSIS | |
| Magic Kingdom |
8
|
6
|
Predictions did well again on Wednesday although Magic Kingdom wasn’t quite as crowded as expected thanks to lower than expected averages at Big Thunder Mountain Railroad (39 minutes, predicted 67), Jungle Cruise (25 minutes, predicted 40) and Splash Mountain (48 minutes, predicted 62). |
| Epcot |
7
|
7
|
|
| Hollywood Studios |
8
|
7
|
|
| Animal Kingdom |
8
|
8
|
|
| WHAT WE THOUGHT |
WHAT WE SAW |
ANALYSIS | |
| Magic Kingdom |
9
|
8
|
The Studios stood out again on Thursday with that park’s highest wait times since Easter. Toy Story Mania hit 82 minutes (predicted 62) and Great Movie Ride reached 24 minutes (predicted 19). |
| Epcot |
6
|
6
|
|
| Hollywood Studios |
6
|
9
|
|
| Animal Kingdom |
8
|
7
|
|
| WHAT WE THOUGHT |
WHAT WE SAW |
ANALYSIS | |
| Magic Kingdom |
7
|
6
|
Crowds settled on Friday with no park hitting a level higher than ‘6’ on our scale. Predictions did well across all four parks. |
| Epcot |
6
|
6
|
|
| Hollywood Studios |
6
|
6
|
|
| Animal Kingdom |
5
|
5
|
|
| WHAT WE THOUGHT |
WHAT WE SAW |
ANALYSIS | |
| Magic Kingdom |
6
|
5
|
Only Animal Kingdom missed by more than one index level on Saturday. There we saw average posted times of 27 minutes for Expedition Everest (predicted 37) and 38 minutes for Kali River rapids (predicted 63). |
| Epcot |
4
|
4
|
|
| Hollywood Studios |
6
|
6
|
|
| Animal Kingdom |
6
|
3
|
|
| July 20 to 26, 2014 |
|---|
Now that crowds have reached typical summer levels we expect to see crowds above average until mid-August.
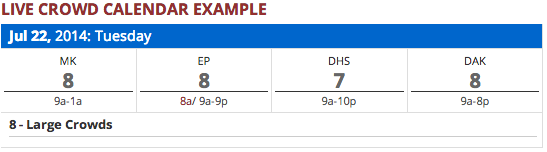
To see Walt Disney World Crowd predictions for the days of your vacation, check the Crowd Calendar.![]()
To get details about our predictions of future crowds or details about crowds in the past check out the Crowd Calendar and select “Jump to Date” on the left margin.
You May Also Like...
-

All four Disney World Parks are now open and crowd levels can be described in one word. Low. Every day has…
-

This weekend will have the longest park hours since Walt Disney World re-opened in July. Extended park hours are a signal…
-
Summer is officially here and July's Crowd Calendar update is now live. If you are tracking the crowd levels on your…
-
Crowded theme parks during the Christmas holiday are as certain as death and taxes. Every year we see crowd levels hit…