
Long Term Wait Time Trends at Walt Disney World
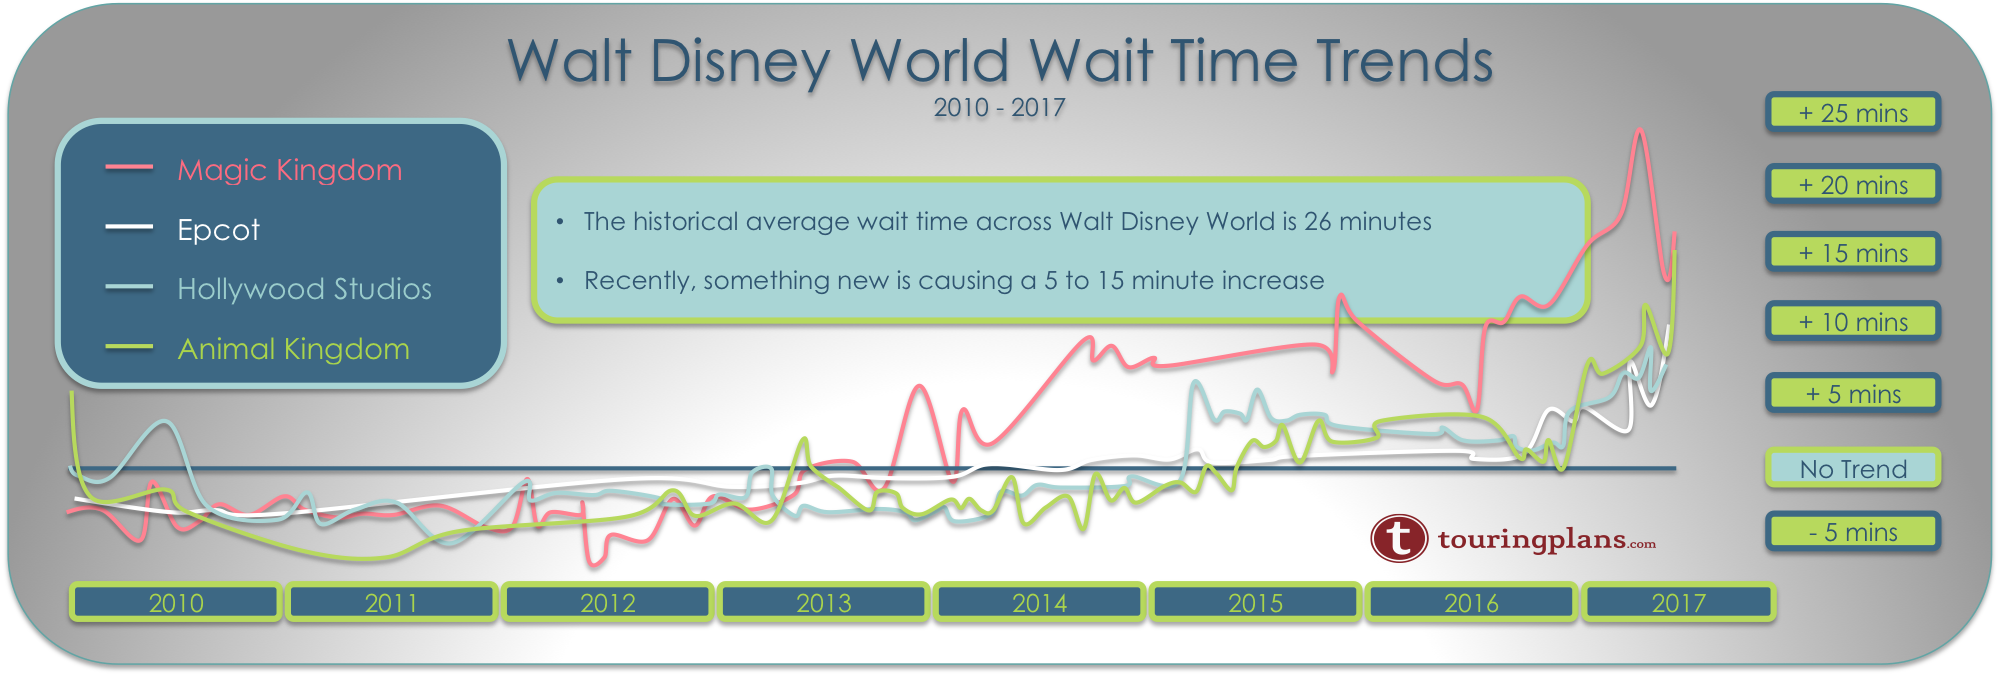
Our Walt Disney World wait time analysis shows that waits are up in the last 8 to 12 months compared to what have seen historically during the same time period. Until recently, we didn’t exactly know why. Take a look at this graph – but it takes some explaining to interpret.
In data analysis we attempt to explain the ups and downs of a variable we are interested in by looking at all the other factors that can affect the variable. Sometimes it can be helpful to isolate one of the variables to see how it (and only it) contributes to the ups and downs. But isolating a factor is difficult because the factors all interact with each other. One can not isolate the ups and downs of wait times that are due to the day of the week without also accounting for days with bad weather, for example.
Anyway, our modelling of wait times at Disney parks allows us to do this – it is called a partial dependence plot. We plot the impact of a particular factor while controlling for all the other factors. When we do this using DATE as the isolated factor what we get is a picture of the unexplained noise in the data that relates only to the date that we collected the wait times. In other words, isolating DATE gets us a picture of the long term trend of wait times.
In normal circumstances, we would expect to see something close to a flat line. According to the graph, we see wait times going up in the last few years across all four parks but especially at Magic Kingdom. So, we asked around. Turns out that Magic Kingdom implemented a hiring freeze in September 2016. That could be an explanation for the spike that we see at the end of the Magic Kingdom trend. Less staff means lower attraction capacity and higher wait times. I wouldn’t be surprised if a similar hiring freeze took place at the other parks as well.
Remember, this is not a plot of the trend of average wait times, this is a plot of the trend of wait times when you hold all important factors constant. So, the trend we see can’t be due to new attractions, good weather, extended park hours, changes in school schedules or a strong economy. We also know that attendance is relatively flat since 2015 so it can’t be that. When we do the same analysis at Universal Orlando Resort we don’t see the same trend. So, it must be something operational at the Disney parks and understaffing seems like the most plausible explanation.
Note: This analysis is for information purposes only, it is not meant to be conclusive, just some observations from the data.
You May Also Like...
-

A new Disney Visa discount offer for Walt Disney World vacations has just been released. Here's the details: This offer is…
-

Although nuiMOs may have taken the spotlight for some, Wishables continue to be a popular mini plush at Walt Disney World.…
-

We love being in the parks, and enjoy bringing you along with us through our social media posts. With so much…
-

Brian is back with something a little different--using aerial photos from the astounding eye in the sky @bioreconstruct, Brian is covering…
It’s FP+… But not directly. The hiring freeze is to PAY for FP+. They horribly botched IT… and in no big coincidence there’s many stories where Disney had some Indian IT companies replacing Americans with Americans training their replacements. Not actually cheaper in the long run.
The whole magic band RF tech was VERY expensive and added NO extra capacity to rides.
But ride capacity can go down through bad operational practices with shutdowns and sub optimal loading.
It’s completely and utterly believable. And ultimately, I just keep going and deal with it. Motion simulator rides at universal are not comparable to WDW. 2 totally different types of rides.
As an avid reader of this site and books, I’ve got all the tricks down for line management.
Because I believe the FP+ system has so fundamentally changed how everyone behaves inside the parks, I am skeptical of the idea of being able to factor it out. Everyone I know agrees that the new system has changed everything about the way they do Disney World, which park they attend on which day, how long they stay, when in the day they arrive, how many attractions they do, whether they stay in the park for meals, etc. I know one thing that has changed for us is the idea of killing time on a ride waiting for that next FP. Just a few years ago, we would have seen a 30 minute posted wait at Small World and decided it was time to get out of the park but now we wait to kill some time until that last FP. And I know we are not the only ones making such calculations.
I enjoy the analysis that your site puts into wait times, and greatly respect the work that you do. However, not sure if I’m buying this explanation. A single chart without any supporting info (the claim that Fastpass+ was factored out without explaining how isn’t inspiring confidence), and a single anecdotal fact around a hiring freeze is a long stretch to present as fact.
The post discussed “holding all important factors constant”. The word important implies that you made decisions around what you consider “important” having an effect, which others might not agree with.
There is no doubt that Disney is maximizing profits – and they should, they are a publicly held company with shareholders that require that, but to present an analysis without supporting evidence, and then fall back on “trust us – we factored the important stuff in” isn’t really building any confidence in your conclusion.
Thanks for the feedback, Chuck. For blog posts like these, we try to balance readability with reference material. In this case, I’m convinced that the blog post with data and technical methods would be either incomprehensible to the general public; or require so much background material to explain that few people would actually read it.
I think this is an accurate analysis. Our trips over the last half decade have all been the week after Labor Day, so predictably among the slowest weeks of the year. While stand-by wait times are low, they do not seem to correlate with the crowds in park. When you walk through an empty Tomorrowland, and then find a 70 minute wait for Space Mountain, there is something amiss.
Perhaps Disney is trying their hand at what the airline industry calls “calculated misery.” If they makes things just miserable enough, they can increase the value or perceived value of the up-sell. If I am just miserable enough from that 70 minute wait, maybe I consider MNSSHP or something of that nature to lower my wait times. I know that we aren’t people who like to spend a lot of money eating in parks, but we have found that pre-RD BOG is a tremendous value for our family because our kids really love 7D. Cheaper than doing the Extra Morning Magic, for sure!
Thanks for this opportunity to really nerd out on statistical analysis. I love it more than grapefruit beer in Germany!
I last visited WDW in Feb 2016 and also visited Universal on the same trip. It was the first time I’d been to WDW since FP+ was launched. I made good use of it in combination with TouringPlans and managed to see and do everything I wanted to in WDW. We spent 4 days (one park a day, no park-hopper) and never waited more than 40 minutes in line – most of the time the wait was 15-20 minutes. And we did all the E-tickets, re-rode favorites, watched all the shows and parades. It was my best trip to WDW. Then we went to Universal and were waiting 60-90 minutes unless we forked out more for their Express Pass. So I really can’t see how FP+ damaged the WDW experience, much less made it inferior to Universal. FP+ is a zero-sum game as far as I can see.
This is really interesting.
I recently visited Walt Disney World in August 2016. It was my third visit, however first visit since the implementation of Fastpass+ and also my first time bringing my 2 year old son. We planned carefully using Fastpass+ following the Unofficial Guides advice, and when at the parks I noticed that queue times were higher than I’d previously seen when visiting in 2011/2012. However, due to having Fastpass+ we were able to experience more rides/shows than I believe we would have done under the old system.
I’ve not long come back from a trip to Disneyland Paris. They still have the old system of Fastpass, going back to that system I would say that Fastpass+ definitely is of benefit if you are able to plan well in advance. As much as it does take a degree of spontaneity out of the day, unless you are at the park for opening under the old system you always seem to be up against it with regards to Fastpasses. I loved how we could plan a morning at our hotel in the pool in Orlando, and get to the park in the afternoon just in time for some afternoon Fastpass slots. In Paris I saw queues of up to half an hour for some of the bigger rides just to reserve the Fastpass, almost immediately after park opening. I’ve no doubt that Disneyland Paris would be experiencing similar challenge with regards to staff headcount as Orlando. I would say to the average guest Fastpass+ would help mitigate any cuts with regards to staff which impacts ride capacity, assuming they buy their tickets in advance. I found it much harder to get on the bigger rides in Paris compared to Orlando.
It will be fascinating to see how this trend continues.
I recently completed a Disney trip on the week of April 8th. It was the first time I’d attended Disney parks on 8+ level crowd days, and it was also the first time I’ve seen frustrated cast members being unhappy in public. There were not many, but there were some, which was kind of sad, since Disney always seem immune to that.
During my trip, I frequently saw FP+ lines long and sprawling outside the attractions. They moved fast but seemed as if there were more FP+ riders than usual. Any chance that Disney has started handing out extra FP+ rides to select guests as perks?
It’s possible, but it would be unusual. The way to check that is to count the number of people in the standby line and compare it to the posted wait. It should show a ratio of around 4 Fastpass guests per 1 standby guest (3:1 at 7DMT). And that’s about what it showed the last time we did it.
Several thoughts as I read through these reader responses:
I agree with TP that FP+ is not the culprit for longer wait times. The beginning of FP+ may have be responsible for the small spike in wait times in 2014, but those times were only 5-10 minutes longer than previous years.
It’s the huge recent spike that should be the real concern, and I don’t think you have to look far for the answer: reduced staffing. Disney is a company in business to make money, and they have found the answers to maximizing profits: reduce staff, raise prices, cater to the upper class.
We have already seen clear evidence of staff reductions and higher prices across the board. To find evidence of catering to the upper class, look no further than to upcharge events and food offerings. Author Ruby Payne states that the three questions that each of the three classes asks in regards to food is:
-lower class: Is there enough food?
-middle class: Does the food taste good?
-upper class: Is the food presented well?
When I see all the articles on Disney blogs about the food at the table service restaurants and the fancy desserts at the upcharge events, I believe this cements my thought that Disney is now, and will continue, to cater to the wealthy. As long as their bottom line continues to show a profit, this trend will not change.
Something no one else has mentioned when looking at the 2014 spike and blaming FP+, is that the spike only occurs in MK and not in any of the other parks to the same extent. Wouldn’t the other parks overall wait time increase if FP+ was to blame. Maybe something to consider would be that New Fantasyland opened at the very end of 2012 including BOG which is a huge draw. Also, SDMT opened in 2014. I would be interested to revisit this graph and subject in a few years to see what the opening of Pandora does to overall wait times at AK. Also notice the spike in 2015 at Hollywood Studios, which could be attributed to the removal of the iconic Sorcerer Mickey Hat, and the addition to of the Star Wars Launch bay later that year.
I thought that a big part of MDE was to allow Disney to better anticipate staffing needs ahead of time. It would seem they have thought they were overstaffed. One of the results of that may have been (in the eyes of some in management) that wait times were lower than they needed to be, because of excess ride capacity. I would hypothesize, then, that higher wait times could be the result of more efficient staffing.
With regard to FPP, I’d guess a lot more people are using FastPasses now than under the original FP system. I would think that would drive standby wait times up. I know you said you somehow factored that into what you’ve presented here, but I’m not clear from reading the original post or your comments whether or not you’re talking about standby waits.
I assume you also include wait times for folks using FPP, but I would guess you also have less data on that, since there’s no way to submit your actual wait time on your Lines app when you use FPP. I’m sure you measure FPP wait times somehow, but it would seem there has been a rather significant change in guest behavior since MDE was launched and I don’t know how you could completely rule that out of your analysis.
Len/Fred,
Maybe you have written about this before and just missed it. Isn’t FP+ a zero sum game in regard to wait times? That is, where you wait less with an FP+, you wait longer for attractions for which you do not have an FP+.
I
Iknow that individuals can reduce their wait times over the general public if Touring Plan strategies are used. But if Fastpasses were abolished entirely, would the Touring Plans strategies work equally or better than with Fastpass?
We know several families who have gone recently and have come back home telling everybody they’ll never go there again. I tried to warn them and point them toward Universal or Sea World, telling them they’d actually have a much better time, but they thought they “had” to take their kids to “Disney.”
We used to go every year. The past couple of years, we’ve gone to Universal instead.
Even my teenagers admit to missing the concepts of “innocence” and “happiness” that Disney World used to represent, but after failing to get the rides we wanted the last couple of times we visited, we have just given up.
We are Disney fans through and through, but after our latest trip in February, we won’t be going back for a very long time. And we will never go on a weekend ever again. Fast Pass has ruined it for us.
Though it spiked even higher in 2016… really big spike started in 2014….
With implementation and adoption of the FP+ system.
Shows, FP+ is something of a gimmick.. robbing peter to pay Paul. The time you save in 3 FP attractions, you pay back in longer lines in other attractions.
WDW park attendance has been dropping but the revenue numbers remain strong. WDW keeps experimenting with more and different special extra ticketed events to get a small group of people to pay a premium price. The expansion of Downtown Disney into Disney Springs with so many different ways for people to spend more money on property instead of venturing out. WDW is adding more rooms to higher priced resorts.
Now we hear that lines are longer because of a hiring freeze. The current news is that sister company ESPN is laying off 100 on air talent.
Looks like the Disney plan is put more efforts into maximizing revenue from the top Disney customers who are willing to pay the extra at the cost of reducing service to the remaining customers.
I believe that the longer wait times are due solely to slower throughput on attractions. Even before FP+ I observed Disney “dragging their feet”. When you must wait 45 minutes for Thunder Mountain Railroad, and then see that only one side is loading (1/2 max capacity) you know Disney is making you wait intentionally. Why? To reduce labor costs? To make you stay extra days to get everything done? To minimize wear and tear maintenance? It’s like going to a buffet, but they put out only a dish or two every hour. It may be all you can eat, but you never get much. Back in the day of tickets for rides, Disney had an incentive to have high through put. You may buy more tickets if you ran out. But with the current setup of pay for entry, Disney has not incentive to minimize wait times. Well, at least until it hurts attendance. Disney manipulation.
I’d guess ride capacities back in the tickets days were close to what they are today, if not less.
I see this on my mornings at Animal Kingdom. Running only one side of Safari and Dinosaur and artificially running up the wait times in the early morning. I assumed this was due to short staffing the parks in the morning.
Increased wait time is due to increased attraction visits or decreased rides per hour (closures, fewer trains in service, or slower loading). If crowd size or PF+ is not to blame, it has to be that guests are becoming more efficient in visiting more attractions per day, perhaps because of better planning beforehand. Touring Plans, you may be helping people better manage their time to ride more rides per day!
Typo: “PF+” should be “FP+”
We are confident this is not the influence of Fastpass+. For one, our models factor that out and secondly, the timing doesn’t match up. We also are confident that it is not due to higher attendance since the magnitude is off. Anecdotally we are also noticing that guest satisfaction is dipping as well. All-in-all, the pressure is building when wait times go up, satisfaction goes down and prices increase. I think something will change within the next year or two to correct this trend.
With great respect to your methods and analysis, it is looking to me like it matches FP implementation and adoption rather well. There is a big spike in 2014, of about 10 minutes. That seems to match the time when guests really started utilizing FP+.
Furthermore, logic and math dictate that FP+ has to create longer standby times. Being the parks/rides have limited daily capacity… And every guest is now “saving line time” in 3 attractions, and more attraction capacity is assigned to fastpass returns, it necessitates the other lines get longer.
Quite simply.. imagine you have 2 lines, and they are both 10 minutes long… with 100 people in both lines. And the people will switch lines after they reach the front. Now, imagine you told half the people in each line, to immediately skip to the front. The non-skippers now need to get behind the line skippers — increasing their wait. The skippers will also finish the line faster, which puts them in the second line faster… thereby further increasing the wait on the second line.
Basically, unless Disney had added tons of capacity (which they didn’t), greater adoption of FP+ would mathematically have to increase wait times.
Simply, line skipping increases wait time for the non-skippers.
You are forgetting that the people waiting longer on line a are waiting less on line b. The average wait is still the same. The only people who lose out are the ones that don’t skip any lines or don’t use FP+ at all. I agree it’s harder to ride the e ticket rides multiple times a day but that’s exactly why a step by step touring plan is helpful. Or just knowing that you should arrive at opening, ride the pipular rides on standby and use FP+ to ride them again later.
I’ve been very frustrated and baffled with Touring Plans’ staff unwillingness to acknowledge how FP+ has negatively altered the Disney experience. The responses on this posting alone, clearly made by people with many Mouse hours under their belts, reveal that seasoned visitors recognize how different and less efficient the experience has become. Argued this with @TouringPlans Twitter feed a couple years ago while actually visiting WDW. TP Twitter guy kept telling me how he secures 8 or 9 FP+s per day… for those incredibly high-priority attractions like Tomorrowland Speedway or Mickey’s PhilharMagic. Prior to FP+ we’d high major attractions several times per day; that’s over now. FP+ has resulted in longer lines and a significantly less-satisfying trip for hardcore Disney visitors. I suspect Touring Plans refuses to acknowledge this because in doing so, you’re also admitting that your actual step-by-step touring plans have become pretty much obsolete.
Thanks to those who’ve had the same experience. I’m going to post my last thought on this. I’ll call it the lingering effect. Let’s say you get an 11 am, 3 pm and 8 pm fast pass schedule. You are now committed to a full day at one park, you have no time between your reservations to leave, plus you have no fast pass currency to use at another park. So you must linger in that park – searching for things to do, so you find other attractions to kill the time – thus creating more congestion at other rides.
In the past, you arrived, managed the fast passes in a linear fashion and departed when you experienced what you cared about. Fast pass+ broke that and without a lot of other data (that you don’t have access to) you can’t model that. Thanks!
While incredibly effective, this site often seems to refuse to acknowledge that the analysis is anything but perfect. I trust math, science and algorithms, but common sense and experience tell me my wait times, and the ways I enjoy the park are significantly different pre and post FP+, despite continued personal analysis and tweaking my planning. “You don’t need a weatherman to tell which way the wind blows.”
And to follow up- I don’t discount the effect of the hiring freeze either…..sometimes there can be two right answers.
We had a substantially different trip this past February compared to other years and we attributed it to the Fast Pass+. It was great fun when we had a Fast Pass, but no fun at all when we didn’t. The lines were too long. I’ve never waited an hour or more for Haunted Mansion or Pirates until this trip. Even Small World was a long wait. Forget the Mine Train or Peter Pan. Whatever the reason, they have made me not want to go back any time soon.
Isn’t it interesting how some will continue to place blame on Fast pass+ even when the presented evidence shows otherwise. I believe that’s called scapegoating.
This understaffing, along with FP+ vs. Express Pass, is why I’m againg going to Universal instead of the Mouse. My kids just have so much more fun without every minute scheduled and not having to wait in ridiculous lines. Maybe we’ll go back for Star Wars.
Disappointing but not surprising. Systematic understaffing has become a trend all across the service industry.
I guess it comes down to the fact that it’s the data that you don’t have that’s going to give you the answer – you don’t have access to individual park entry/exit behavior which may shed some better light on this question.
Honestly, the introduction of fast pass+ is the likely driver here. Fast pass+ has fundamentally changed how people “do” Disney. People are now forced to schedule their attractions months in advance, selecting attractions they may never have even ridden as a fast pass. The scheduling also keeps them in parks for longer, searching for other attractions to fill the time before their next reservation, generally increasing wait times across the board.
I don’t think we view this as Fastpass+. The analysis factored out the impact of FP+ on wait times. The best guess we have (and we’ve spoken to Castmembers about this) is a hiring freeze.
Can you explain how you “filtered” out for+?
That’s an interesting idea. If people are in the park longer, are food and beverage sales up?
Fast pass plus should have been around long enough that wait times should have settled into a nice before and after pattern that TP should be able to account for in analysis.
Wouldn’t longer time spend in attraction queues mean less time for food/bev/merch buying?
The model is already adjusting for the introduction of FastPass+. The chart is showing that there is some other factor(s) causing wait times to go up. We don’t have daily attendance numbers, but Disney in their quarterly reports says WDW’s attendance has been flat. This made us hypothesise that capacity may be lower. Fewer cast members would cause lower capacity.
Interesting stat approach… so if the variable appears to be capacity as a consequence of fewer cast members to serve guests, then can we conclude that they are more concerned re increasing profit share? It seems that decision makers can “get away” with the reduction in service because they continue to make money.
If true then the only recourse guests have is to take their football someplace else. And there are several yes-buts to that!