Disney World Crowd Calendar Changes
Happy New Year!
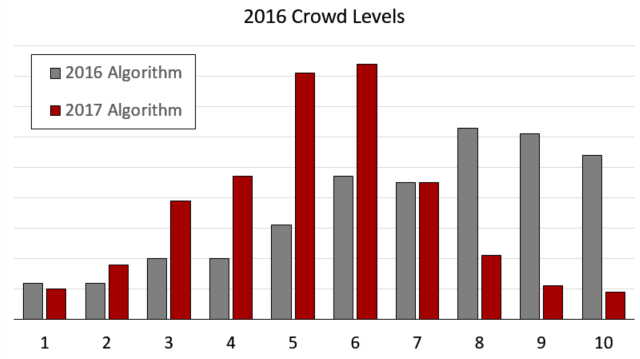
Back in June and July, we mentioned that there will be tweaks to the Crowd Calendar in 2017. The changes are minor and are intended to better differentiate the crowd levels on different days. Looking back at the 2016 data, the crowd levels were skewed. We want the distribution to be a “normal” or bell-shaped curve. Having half the days in a year a 8, 9, or 10, is not good. We are not re-writing history; we are re-defining what the crowd levels mean. For example, an average wait time of 100 minutes at Space Mountain was a “10,” but with the 2017 adjustment it will be an “8.” It will now take an average wait time at Space Mountain to be above 127 minutes to be considered a 10. Wait times have increased, so an adjustment is needed.
What Is Not Changing
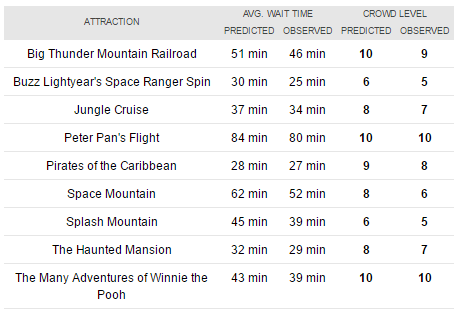
Crowd levels are based on wait times at core attractions. Each of the core attractions is scored on a scale from “1” to “10.” We show the details of the predicted and observed data that determined the crowd levels. Just go to the Crowd Calendar page and use “Jump to Date” on the left-hand sidebar to go to a specific date and then click “Click here to see individual attraction details used in determining crowd levels” under each park.
What Is Changing
The new algorithm will use daily average wait times between 11 am and 5 pm. This is dropping the 10 o’clock hour from the prior algorithm. The early hours of the day are not good indicators of an entire day’s crowd level. Attraction thresholds for assigning the “1” to “10” scale are being adjusted to ensure that attractions’ average wait time distributions are evenly covered.
Historical Data
We have applied the new algorithm to the 2015 and 2016 data on our Disney World Historical Crowds page. This will give the current analysis a historical view of the past data using the same method that the future crowd levels are using. The daily Crowd Calendar pages will only show the observed data. We are not showing the predicted values because we don’t have predictions based on the new algorithm. We have archived the old observed 2015 and 2016 Crowd Calendar data, and you can download it here.
You May Also Like...
-

The April Crowd Calendar update only has minor changes. We are halfway through spring break, and crowd levels have been in-line…
-
We have been holding off on doing any big Crowd Calendar updates until we saw how the crowds were in 2021.…
-

The February 2020 Crowd Calendar update is now live. So far 2020 is showing increased crowds at Walt Disney World. We…
-
All four Disney World Parks are now open and crowd levels can be described in one word. Low. Every day has…
If you did want to change to 7 levels, maybe you could change to “T-shirt sizing” (XXS, XS, S, M, L, XL, XXL) to avoid confusion with the old levels. You could even have a handy “conversion chart”: 1=XXS, 2=XS, 3-4=S, 5-6=M, 7-8=L, 9=XL, 10=XXL.
On page 495 of the 2017 Unofficial Guide, there is a chart “When Same-Day FP+ Runs Out, by Crowd Level.” Since the crowd level changed, does this chart still apply?
Thank you for your work. I still trust you guys, but am just confused.
https://www.youtube.com/watch?v=M9d7oG4WTyY
Quick question about the archived data available for download. I’ve been specifically comparing the Predicted vs Observed numbers for 2015 and 2016 to help select a week. I noticed in the download that the numbers for Animal Kingdom and the predicted numbers NOT the observed. The other 3 parks all show variance from the Predicted.
This was the same time frame that you reported trouble with the overall system for reporting Observed numbers. Is the Animal Kingdom data for June one of the things that was lost?
I should specify. The Animal Kingdom levels for June 2016 are the ones that are just a copy of the Predicted levels. I don’t know if the rest of the data is correct or not.
Nathan- Are you saying the number for AK in the PDF are the predicted numbers, not the observed?
Yes, the data listed for AK in June of 2016 is simply a copy of the predicted numbers and does not appear to be the observed numbers. I had been copying data from the weekly reports up until they stopped being published regularly.
At this point my group has made it’s decision so I don’t really need the data anymore. I just wanted to let you know that there were still an inaccuracy in the file. I’m assuming it’s due to the same issue that stopped the weekly reports and resulted in the loss of data for all parks June 25-28.
Thanks Nathan. I verified the data and the PDF is showing the predicted crowd levels. We will fix this in the next 7-days.
Wait, I thought crowd level mapped to percentiles, so that each crowd level should have the same number of days, not a bell curve or normal distribution. See:
http://blog.touringplans.com/2010/05/17/crowd-calendar-2-0/
“Crowd Calendar 2.0 is based on a percentile rank.
Imagine you have a box of 100 marbles of different sizes. If you sort the marbles from smallest to largest you can divide them into ten groups of ten, according to size. The largest ten marbles get put into Group Ten. The next ten largest get put into Group Nine, etc.
In our case, we are sorting all the possible crowd sizes at Walt Disney World into ten groups. The highest ten percent get a rank of ten; the next highest ten percent get a rank of nine, etc.”
Matt- That blog post is from 2010, and for the past three years we have been at Crowd Calendar 4.0. (Crowd Calendar 3.0 never got released.)
Thanks! Is there a page that explains why Crowd Calendar moved away from percentiles?
I liked the oercentile system. It was easy to understand what each number meant. Also, it made sure that each value was equally used.
The new bell curve seems to compress more days in a smaller range of values. A group of days that might range from 4-7 using percentiles might all end up as 5-6 in the new system.
It also could be confusing because the increases in crowd values is no longer linear. In other words, the difference beteween an 8 and a 10 seems much greater than the difference between a 4 and and a 6.
I do really love that Touring Plans takes real data and statistics so seriously. And I really appreciate you taking the time to explain the methodology and to answer our questions. That’s why I trust and recommend Touring Plans.
There are three reasons we went away from the percentiles.
1. The box of marbles keeps changing. Drop one day and add a day. With the 365 days, the crowd level could change just because the rolling window is changing.
2. The distribution of wait times is closer to a normal distribution than a uniform distribution. There are more 5s and 6s days than 1s and 10s. Forcing the calendar to have 36 1s and 10s is a problem.
3. Having the fix ranging makes comparing days easier, and makes validation by us and users straight forward.
With Crowd Calendar 4.0 we removed the decimals. It was implying a level of accuracy that is not possible.
No system is perfect. Each has there pro’s and con’s.
Sure, I understand that any system has tradeoffs.
“The box of marbles keeps changing.”
That’s also true with the new bell curve system. Like you wrote, a 10 in 2016 is now an 8 in 2017.
If you are going to keep using a bell curve, might it make sense to have an odd number of Crowd Size values, like 1-9, instead of an even number?
Right now, the most common days are getting split between 5 and 6, implying a significant difference when they are actually quite similar. A scale of 1-9 would allow 5 to be the absolute median point with the highest number of days. This would make the difference between 4 and 5 and between 5 and 6 more significant.
I personally would like a 7 point scale where 1’s and 7’s would only include the very extreme values. So it would mostly have 5 levels, 2-6. Users have become used to a 10 point scale, can you imagine the reaction if we told people a 10 is now a 7. I have been thinking about writing a post about possible crowd calendars system and see what the feedback is.
I agree that the crowd calendar should continue to reflect on attraction wait times as this is what most of the subscribers and readings of the “Unofficial Guide” are concerned with.
However, one thing I fear may confuse some of your customer base is that a crowd level does not equate to a specific wait time at an attraction at different parks. When the weekly crowd calendar reports were published, a crowd level of 8 meant a significantly lower wait time at a Universal park than a Disney park.
I hope when your algorithm is corrected we can see the weekly crowd reports article published again.
I agree with the adjustment in the scale. Last year, we went 3 times. There were 9 or 10 days on at least two of those trips. However, one of those trips was between xmas and NYE. Those 10 days couldn’t remotely compare to the 10 days that we saw in mid-March. Unless you are going to pull a Spinaltap and go to the proverbial 11, having both of those times be 10 just didn’t make sense. I also think people get a little hung up on the crowd levels. It’s fine to use it to pick a time for your vacation. However, once you have picked that, usually crowd levels at each park will only differ by a point, which I think is not noticeable by most people. There are certain times or events that make the crowd levels a lot different, but those are fairly rare during the year. I am glad that the levels are being readjusted. Now, about how they have readjusted women’s clothing sizes so that everyone wears a smaller or the same size, even though we are getting bigger, that I don’t like.
The crowd calendar is used in different ways. Most users initial use is to compare different times to help choose when to go to Disney World. Once a user has booked their vacation, the crowd calendar helps select what parks to go to on what day. In either case, if we had most days 8, 9, and 10, it would be more difficult to differentiate crowd levels. (It would make crowd level predictions easier for us.)
We could have changed the scale to be 3 to 12, but that would have confused too many people.
Stats question re: the distribution of crowd data. I understand what a normal/bell curve is but is the distribution of crowd levels at Disney World normally distributed? Height and IQ, for example, are normally distributed, but are crowd levels at Disney World normally distributed? That is, are most days at Disney World a 4-6? If most days are at the higher end of crowd levels (as measured by wait times), that would mean it is a skewed distribution, right? In that case, shouldn’t your crowd level labels also be skewed?
Does this new (normal) distribution of crowd level labels match the distribution of DW crowd data?
Doesn’t it skew the numbers to say “[w]e want the distribution to be a “normal” or bell-shaped curve” unless the numbers naturally form a bell?
Say (for simplicity), most days WDW has 8,000 guests. On a few empty days, they have as few as 1,000, while on the most crowded days they have 10,000. The average days (8,000 guests) shouldn’t have a “5” rating, because then the busiest day (which gets a 10) and the least busy day (which would get a 1) would both be 5 levels from the average, even though one is much, much closer in terms of actual numbers. In other words, I submit that the actual “number” for the day is less important than the differences between the numbers. If a bell curve and calling the average a “5” regardless of the distribution is artificially forced onto the numbers, then the differences between numbers are variable and therefore not very meaningful. In other words, a difference between a 1 and a 3 would be significant, while the difference between a 4 and a 6 would not. IMHO, any difference of 2 levels should be equivalent to any other difference of 2 levels.
Larry, Brian, and other asking about a normal distribution…
Saying we want a normal curve might have been a miss statement. What would have been more accurate is that we want a distribution where the mean is between 5 and 6, and have days that cover the range of 1-10. We are not forcing 68% of the days to be within one standard deviation.
Back in June, I talked about the wait time distributions and how we convert wait times to crowd levels. By converting crowd levels to a 1 to 10 scale, we are normalizing the different attractions’ distributions. Hopeful a park average rating of ‘8’ is more meaningful than the average wait time is 56 minutes. (Is 56 minute high, low, good or bad? What attractions are included? 56 minutes is not bad for Frozen Ever After, but high for Living with the Land. 56 minutes at 2 pm or all day?)
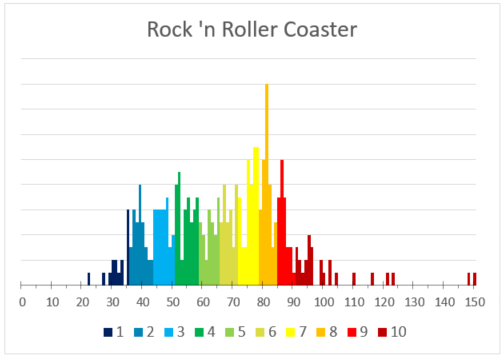
The ranges, for each attraction, are defined so the bottom 5% are 1 and top 5% are 10. The range of values between the 5th and 50th percentiles are evenly split into four groups for 2-5. The range of values between the 50th and 95th percentiles are evenly split into four groups for 6-9. This forces each attraction to cover the full range of 1-10. It does not force the data to be normally distributed. The Law of large numbers will cause the combining of attraction crowd levels to have the normal curve.
Steve,
Thank you very much – that explanation makes a lot of sense. However, I think it is potentially confusing that the ranges in the middle are narrower than those at the ends. If I understand right, this only affects the difference between from a 1 to 2 and 9 to 10, though.
Thanks again.
Yes, the 1 and 10 ranges are larger. Part of this is to have an outlier (real or an error) to over influence the 1-10 distribution. Looking at the Rock ‘n Roller Coster distribution if we use the min and max, and had equal ranges the scale would be:
There would be 2 10s, 0 9s, 3 8s, and 5 7s. That is 10 days out of the year with a score above 6.
Thanks for the thoughtful explanations. Maybe this view can help everyone digest the numbers. WDW crowds have been on an uptick the past couple of years. Wait times have increased. The normal historical flows of attendance have changed, slow seasons are not as slow as experienced prior.
What does this “mean” mean? The “mean” of 5 to 6 does indeed mean crowds because the majority of days at WDW see crowds. Levels of 7-8-9 represent more crowds, morer crowds & morest crowds respectively. 10 means bat-poop crazy & high likelihood your ankles will get bumped with strollers and EVCs all day long.
You can probably count on your fingers and toes the number of CL1-2 days to be expected in 2017, and even on these days you will see thousands of guests. Do not interpret a CL3-4 as low attendance, instead realize the expectation is it will be a bit better than your average extremely busy day in WDW parks.
You will be happy you devised a plan as that will be your best asset 🙂
Thanks for the update, but I still wish you would add some mechanism to account for the crowds at F&W & F-G at Epcot. I suggest treating the booths like rides and allowing Lines users to submit wait times for each booth. In our experience at both festivals, using ride wait times to predict crowd levels is worse than useless. Most people aren’t there to ride the rides. We’ve been to Epcot on a “5” day during F&W when we literally could barely walk around WS. The crowds on Christmas day at Epcot were smaller this year than that.
Another glitch we noticed with the crowd calendar over this last Christmas was that on almost every day we were in the parks, the predicted crowd level was a 9 or a 10, however, the actual “crowd feel” was less than when we’ve gone in May and September on “5” or “6” days.
This leads me to believe that your algorithm (which solely depends on ride wait times) is no longer doing a very good job of predicting actual crowd level.
Now I see how the phrase “60 is the new 40” evolved.
Twenty-five students in my son’s math class:
Twenty receive “A”s and five receive “B”s.
I still don’t know if my son is the smartest if he gets an “A”, but I feel confident that he’s good in math.
There are 3 kinds of people reading these blogs: Those that are good at math and those who aren’t.
Thank you, Touring Plans – You let me know when the parks are crowded; you let me know when the parks are not so crowded.
You let me know when the rides are busy; you let me know when they are not so busy.
Your information and the service you provide is very valuable and most appreciated.
It may be time to rethink basing the crowd calendar on wait times. Anyone visiting Disney parks should really be avoiding Standby lines as much as possible (some waiting is inevitable, but it should be minimized). Judicious use of Fastpass should eliminate a great deal of the waiting, and we all know that Fastpass is actually increasing standby waits, so it’s not a particularly good metric to use for this purpose anyway.
I’d prefer the “crowd level” to be reflection of the feel of walking through the park, personally, since that’s my greatest pain point. For example, when parts of a park are closed for reimagining, it can make the rest of the park feel more crowded, even when there are fewer guests. Obviously this would be a difficult metric to obtain, requiring some guest sampling, but if anyone were capable of doing this, you guys could.
Note: I’m not suggesting this should replace the way you report on wait times, but that could be a separate metric. Because I think both are just as important to many people. Kind of like “How long will I wait?” vs. “How often am I bumping into people?”
Anyway, just a thought. Really appreciate all your hard work, and I recommend you to all my friends.
I don’t understand WHY wait times are up – every independent Disney blog and podcast I read or listen to keeps saying park attendance is down, park attendance is down. Disney is cutting jobs because of decreased park attendance. How in the world are wait times increasing with fewer people in the park? I guess Disney decreases staff and subsequently ride capacities so they can “justify” their ever increasing prices; Hey, wait times are so high because so many people are here so we have to increase prices of everything – supply and demand, right?
They should have used the billion dollars to build a fifth park or more attractions in all parks, as opposed to Magic Bands. Disney Parks aren’t going anywhere and neither are the people willing to go. They need to add more attractions to better distribute crowds. And they should be able do that at the same rate as Universal and not take many years to add two rides.
I think you’ve nailed it, Melinda – we think a large part of it is staffing and capacity changes.
We think something similar is happening with hotels. Regular hotel rooms are being converted to DVC. Combine that with the regular closure of large blocks of rooms for refurbishment, and you’ve shrunk supply.
Len, it seems as though the manipulation of wait times via adjustments to staffing coincides with the implementation of Magic Bands. Are we now seeing WDW utilizing the data that’s been accumulated from the MB’s, or are they just being much more dynamic in managing man-hours?
According to the email I just got, these changes made the crowd levels increase by 1 almost everywhere on the weeks I’m planning to go (mid-Sept and early Nov). So, at least I’m not expecting to see what I called a 3 last time, but have it actually be busier… I still always go the week after Labor Day since that’s the historically lowest crowd week.
Becca, I got a Crowd Tracker email this morning as well, but I think the conclusion is just the opposite – the the changes Steve described above will reduce the numbers for a given level of waits. So when you (and I) get a notice that our crowd levels have gone *up*, that seems to mean that a *real* increase in the crowd prediction has happened.
Seems we’re going to have to manage our FastPasses carefully. (And my trip is in two days – time for a quick review of my plans!)
I thought the same as you Nicholas (and my trip is also in just a few days). The crowd levels for each day of my trip stayed the same or went up (I would have expected from this post for them to go down). But when I updated my touring plans, nothing changed at all!
Makes total sense to me. Every day cannot be an 8, 9, or 10. I get what a bell curve is. I’m just happy to be there and I go when it works for me – not chasing the low crowds.
This makes sense to me. Just for understanding historical comparisons, perhaps there could be a discussion of what defines a “5” under the different models. Thanks!
We have tried to describe what to expect on the different crowd levels. We have a page for each park:
https://touringplans.com/magic-kingdom/crowd-levels
https://touringplans.com/epcot/crowd-levels
https://touringplans.com/hollywood-studios/crowd-levels
https://touringplans.com/animal-kingdom/crowd-levels
The tables show the range of peak wait times for attractions. Of course, a Touring Plan will help you avoid the attractions with highest peak wait times.
Thanks Steve! I am a subscriber and Touring Plans does help me to avoid peak wait times. Specifically, on my last trip, it used it to find a low wait time window for me and my son to re-ride TSMM. Made his day!
“Math is hard” as they say, so thank you for doing it for me. I’m constantly amazed by the great non-anecdotal work that goes into this site!
I appreciate the updates and it seems like it should be done yearly to me. The scale is a relative scale not a “number of guests” in the park. If 5 is supposed to represent the average number of people in the park then as the yearly average moves so should the scale around that number.
Good job Steve and thank you.
Thanks for your work in giving us accurate models to work with.
Were the only recent changes, changes to the scales? For example if my crowd calendar for a certain day changed by a level of 2 for a given park, will my touring plans stay exactly the same (because even though the crowd level went from a 4 to a 6, the old 4 is equivalent to the new 6?)
The simple answer is YES. Attraction wait time predictions are used for the crowd calendar and the Touring Plans. We update attraction wait time predictions about once a month. The updates use the most accurate park hours and observed data. The attraction wait time predictions may change your Touring Plans. You can click the optimize button to see any changes.
Thank you for the notice and explanation. Applying this to historic dates should alleviate the fears of those above who have a “feel” for what a given crowd is/was. I would imagine that the best use of these numbers assigned to a given day and or park is simply for comparison day to day or park to park. For instance on a recent trip I picked one park over another because the number was three lower. This is more important than what they may have previously felt like. Additionally I would like to add I appreciate the value of this site as a planning tool. My kids like to say we go one way and the crowds go another. Disney will continue to try to fill the parks to capacity at all times as they should and this site is covering up nothing… simply presenting us with data for those inclined to pay attention to such things when planning. Thank you and keep up the good… no great work.
Some people clearly do not understand Data models and their purpose.
^ Exactly. This is statistics at their finest (if there is such a thing…)
Indeed, few people “understand Data models and their purpose”. And this is a prime example of why most people distrust statisticians and statistical methods.
Having the scale go higher, as suggested by Tim above, would make more sense to most people.
Just wondering though, if you know “few people understand Data models & their purpose” & that “having a scale go higher would make more sense to most people” & the fact that many of the people who read your blog & pay to use your crowd calendars are in this majority, why do you cater the scales to the minority who “understand” your methods?
Karen, I suppose it’s because they’d rather be accurate and attempt to educate people than feed into misleading beliefs that the masses have.
From what I understand, suppose last year a wait of 30 minutes was average for a ride and 50 minutes was extremely high. The 30-minute wait would be a “5” crowd level and the 50-minute wait might be, say, an “8.” Well, looking at the statistics they realize that most days last year actually had a 50-minute wait, with some days higher and some lower. So now they call the 50-minute wait a “5” crowd level, because, although the wait didn’t change, that’s the average level on a normal day at WDW.
Thank you, Larry, for that very helpful info! I guess, in the end, I would rather pay for a subscription that is going to tell me if I’m going to be packed like a sardine at a park or if I’m going to have a carefree enjoyable time because crowds are lower. I like the numbers to tell me what the actual “crowd LEVEL” is.
Karen – the way I understand it is that the crowd levels are relative to other days, so that will give you some sense of feeling like a sardine when you read or hear about people’s experiences on “busy” or “not busy” days. The wait times for rides are objective factors and up to each person to decide – is a 50 minute wait for a ride something that’s going to ruin your day and make you feel like you didn’t get to experience many attractions, or is that something that you’re comfortable with? If you think that’s too long to wait for a ride, then look to go on a day with a lower crowd level than the day you were looking at.
I may be in the minority with Bob, but I agree with what he’s saying. It also feels like blogs like this are trying to “pull the wool” over our eyes & make the crowd level appear acceptable so Disney can keep piling/herding us in we are none the wiser until we show up & are in the thick of the crowds. I realize you are making this adjustment transparent here, but how many people will notice this article/update? I appreciate your hard work too, but Disney (over the past few years) feels more & more like it is only for the rich & we poor people have to save & save for it & get there only to find there is so little we get for our money (like not being able to enjoy rides because they’re so packed full). Just my little rant this morning….
TouringPlans doesn’t work for Disney. Presuming they are in collusion is unfounded.
No, I never thought they were in collusion & as I said, I appreciate their hard work. But, it’s also naïve if someone doesn’t realize- if Disney goes out of business, so do the bloggers…
I wasn’t trying to start an argument, just sharing my own opinion. But it seems, everyone’s ready to jump on anyone who doesn’t share their view.
Once again, Thank You TouringPlans for the hard work you do! I’m sure Disney will stay in business & your jobs won’t be threatened. LOL!
Thank you for the update – will you be doing this with Disneyland as well?
A Disneyland and Universal crowd calendar update will be coming soon. The Universal distribution is not skewed, and the ranges do not need to be changed. The Disneyland distribution is only slightly skewed and we will like not change the ranges.
I may be in the minority, but I’ve never liked your 1-10 scale for just this reason. If I’ve used your site to evaluate crowds in years past and have a feel what an “8” day is like, that becomes less meaningful when you change the definition of what such a day is.
I appreciate the work you do and you may say that your system makes sense to compare the most and least crowded times to visit the parks in a given year, but it makes it much more difficult to know what sort of crowds to expect when your numbers change from year to year. I would much prefer half the days in the year to be listed as 8, 9, or 10 (or even, gasp, to have a scale that went past 10) to make it easier to know what to expect based on my past visits to the park using your planning tools.
In any case, I also appreciate your openness to sharing your methodology and for listening to feedback from your subscribers.
I agree. I understand the need for adjustments, but don’t like the idea of changing definitions. I would prefer the scale go up to 15. Definitions don’t change and the scale becomes more precise.
Ah, the old Spinal Tap solution.
I agree a 1-10 scale is not a perfect system. We have thought of different ideas, but everything has its pros and cons.
We have re-scored the 2015 and 2016 data so you can see your past dates and have a reference point of the new scale. If your “8” is now a “7” you have a feel of what the current “7” feels like.
To get to the Historical Crowds data, there is a link on the left for the crowd calendar page.
https://touringplans.com/walt-disney-world/historical-crowds
Steve,
Thank you for your response and I really do appreciate all the work you guys do. I understand the way you present the data you collect, but think it would be more meaningful to the average guest to have a more absolute scale. I know this isn’t a new idea and you’ve heard it before, so I won’t belabor the point.
As for rescoring recent years. That is helpful to me, since I keep track of nearly every day I been in the parks since 1979, but I think I’m a bit of an outlier in my pedanticism. I’m not sure the average person will want to go back and look up how the days they visited the park in the past rate on this new scale or even whether they’ve kept track of what days they were in a particular park. Though, maybe the average Touring Plans subscriber is different than most park guests!
Going to check my previous dates from 2015 was the first thing I did, and I didn’t need to look anything up, I still remember exactly what day and what park 🙂
I do admit I’m probably not “normal” either
I keep all data like crowd levels from previous trips in spreadsheets, and went back straightaway to update them and compare.
Yes, I am a nerd 🙂
I love it. Thank you for your hard work.
Agreed. Fantastic work.