Can I Trust The Crowd Calendar?
We get a lot of messages from people asking about the accuracy of the crowd calendar. The estimates we provide are based on a model that incorporates dozens of factors like park hours, parade schedules, weather, proximity of holidays, hotel occupancy and historical crowd levels. When the factors themselves change, it results in a change to our predictions. What this means is that the higher the risk for changes, the higher the chance that the predictions will change as well.
If you are planning your trip twelve months from now the calendar will give you a good sense of what to expect but it is likely that it will not be the exact crowd conditions when the time comes for you to set foot in the park. If we were that good, we’d be retired, writing the Unofficial Guide to Bahamian Beach Bars by now.
All this being said, here is the latest comparison of what our model predicted and what was actually observed in the Magic Kingdom since March 4, 2009. Before commenting on the times that the model is wrong remember that this represents the better part of my life’s work over the last 5 years. Here’ goes…
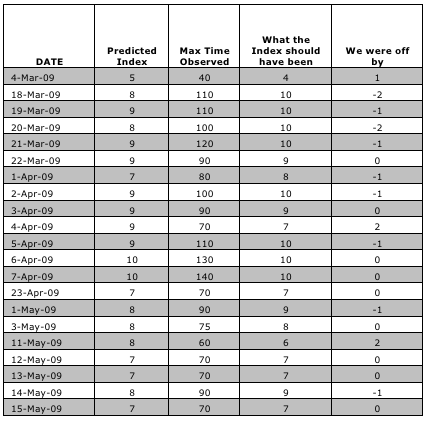
So, it seems that we’re right more than we’re wrong, which is good. There were some days in early March where we underestimated quite a bit. These are the days that even Disney had to adjust its park hours to accommodate the unexpected influx of guests. Still, there’s a lot of room for improvement here. Despite measuring every thing under the sun that has to do with crowds, there is enough variability in the size of crowds to cause us to be wrong now and then.
When we’re wrong, it’s not by much. This was a sample of 21 days. Our predictions were correct almost half the time and within one 80% of the time. We were off by two index levels only four times and never off by more than two. The good news is that we’re wrong equally as often on the high side as the low, so at least the model is centered.
So use the crowd calendar whenever you need to get a feel for what size crowd you will face but understand that it comes with a certain degree of uncertainty. Hopefully, our readers will continue to send us their wait times through email or twitter so that can continue to improve.
You May Also Like...
-

We have had a few weeks to observe the wait times at Universal Orlando Resort since the parks reopened in June.…
-
Everyone's number one priority right now is to help slow the spread of COVID-19 by practicing social distancing. Disney did their…
-

Our latest Universal Crowd Calendar update was incomplete. We have now updated the dates that were missed. For a description of…
-
Wait times at Universal Orlando Resort are up, especially at the Universal Studios Florida park. We have seen crowd levels at…
Hi, I hope the predications are accurate. We moved our holiday up 2 weeks in March when we saw on the crowd calendar that the week we were planning on going was in the middle of spring break season. Once your kids grow up you tend not to think of stuff like that.
Does the crowd level apply to all parks for that day or just the one you are recommending to visit? I know, I know the touring plan is more important but I still want to know! Example Dec 8, 2009 is says avoid DS. However, if you want to see Fantasmic it only runs on Tuesday and Thursday that week so you cant avoid it. I feel like there should be a number per park so you know is it a 4 vs 5 or 4 versus 8.
I have a similar question. What if DS (or any park) isn’t listed as a park to visit or avoid? Like on Dec 21 and 22, 2009?
Touring Plans are absolutely the best thing ever so far as trying to beat the crowds, don’t even try to question it! We are avid WDW fans and visit frequently. We’ve been on peak crowd days & much lower (4&5’s)but honestly, we would not have been able to tell the difference between them so far as the crowd except for the crowd predictor told us so. There is just no comparison to what you are able to do with a touring plan compared to no touring plan. Another huge must is arriving before the gates open! Can’t stress touring plan or early arrival enough! Thanks Fred, Len, & everyone for your research! We love you!
We were there March 14-21 and were expecting 6 crowd levels. I didn’t find the parks outrageously crowded and we were pleasantly surprised! I am shocked to read that those crowds were actually 10’s! To be honest, we were glad for the crowds because the extended evening hours were the BEST!!!
Just wondering why on the Unofficial Guide Crowd Counting Results, there are days for example like Disney Studios that say Friday and Sunday are the longest wait times, however on Sunday Sept 6, 2009 you have Disney Studios as the best park to go to for that day. Can you explain because that is when I will be there and I am trying to plan out my park and dining schedule and have never run across this conflict of your schedules. I have used your calendars for the last 4 years, so I want to make sure that there was not some kind of mistake. Thanks for any insight you could provide!
Any thought of recalibrating? I mean, there’s hardly and days the whole year at “4” or under–why have 1-3 in the scale at all? Yet there are several days that qualify as >>10. Why not recalibrate to reflect this difference so that the difference at the higher end of the scale if more appreciable.
Absolutely! I agree. That’s one of the weaknesses of the calendar as it is now in my opinion. Ideally we’d have a score function that simply ranks the days into 10 groups. The least crowded at one, second least crowded at two,…,most crowded group at 10. The trouble is that we want the index to represent something real in the park against which we can measure. Any ideas?
Maybe something akin to a heat index. It’s a “10” but feels like a 12!
I agree that something tangible, like hard numbers in wait times are needed. It’s much easier to calculate wait times as opposed to “how long it takes to get from point A to point B with a stroller.” I suppose at some point there in no longer a simple linear relationship between increasing wait times and how “painful” it is to be in the park. Probably very few people get in a line when the standby wait is >90 minutes…yet the difference in crowd density between random day in July and Easter Sunday (either of which may easily get this wait time) is probably quite palpable.
Maybe how quickly fastpass is gone at the most popular attractions gives some additional measurable dimension of not only wait time but crowd density.
Fred, how about this to solve the calibration problem: Allow numbers above 10. If you think the max wait will be 120 minutes, mark it 12.
Just a thought. Could you assign a number 1-? and the number assigned represents a specific amount of wait time (say 10 minutes)? A crowd level of 6 would equate to a 60 minute wait?
We are heading to Disney the week before Christmas and are looking forward to putting your touring plans to work.
Just returned from Disney today. We were at the parks the 15th-18th, and using the Touring Plan for Adults guides up until the afternoon, the longest wait we experienced the whole trip was 25 minutes. This is on scheduled days of 8 and 9s, so we were pleasantly surprised.
Certain rides we walked on in merely minutes when the wait time was supposed to be 15 minutes, such as Spaceship Earth. Most waits were fairly accurate though, the longest waits were for Maelstrom in Epcot, and Jungle Cruise in Magic Kingdom, but neither longer than 25 minutes. In Jungle Cruise we were given a pass to give the man up front so they could determine how long the wait truly was. Using the guide and knowing when to get Fastpasses helped a lot, we rode almost all the major rides and several minor rides as well.
We found that by afternoon, if you got the major rides done in the morning with little waits, the rest of the rides evened out pretty well, avoiding the criss-crossing the park. Yesterday rained all day yet Magic Kingdom stayed busy. We got on Splash Mountain right as the rain really started to pour (without ponchos). Every part of the ride out in the open we were pelted so hard we couldn’t see. When the ride was over we were truly dripping wet. When we pulled into the exit area, the ride had stopped operating, no surprise. Not much fun, but the whole day Splash Mountain had waits under 25 minutes it seemed!
Don’t let the Crowd Calendar scare you, with a good touring plan you can be assured to get through with little waits!
Well said. With a good touring plan the crowds don’t matter that much.
I’ll echo Rachel. I was at Disney during dates in the above table (March 14-22, 2009). It was my wife and I and three kids, 2-9. We followed the touring plans each day and had only one wait over 30 minutes all week. We stayed at the Poly which was great because we could pop over to MK after dinner and walk on numerous rides like Pirates and Mansion. It also helped to make maximum use of regular fast passes and baby fast passes.
Toy Story Mania was my favorite! Loved the “surprises”! We were in the parks 5/11 – 5/15 and wait times were quite manageabel – walked onto buzz and star tours 2x in a row, BTM 10-15 minutes. Only had to fastpass soarin and splash mountain. Dumbo,pooh and toy story were the longest @ 20-30 minutes.
We just returned from eight great days in Disney. We followed the touring plans exactly all days but May 16th, when we repeated our two kid’s favorite rides. We never waited in a line longer than 20 minutes at any of the parks. The 20 minute waits were for rides where it would be expected, like the Speedway in Disney. Follow the touring plans and all will be well with the world! By the way, the enite family thought Toy Story was a huge fat disappointment!
I love the website and book and I understand that the variables for August changed once Disney posted the schedule but I am still curious why the crowd calendar changed so much for August. It seems the crowds are expected to turn off like a tap on August 1 (eg. all 7 & 8 in July and then all 6 for the first half of August). The biggest change was on August 16 where before Fred had it at a 9 and it has now become a 5. Any explanations? thanks
Its likely that the park hours for that day were very different than what was done historically. Before Disney officially announces park hours, we assume that they will do something similar from the previous years.
I’m confused. Your chart here says that March 18 through 21 were predicted to be 8’s and 9’s. But I’m sure that prior to our trip on those dates, your chart had every day predicted as a 6, unless you changed them on March 17 (they were still listed as 6’s on March 16, our travel day to Orlando). Is that what happened? Thanks.
Yes. As Disney changed the park hours each day, our predictions were adjusted. Too late to be useful for any of our readers unfortunately, but essential for us to track our predictions.
You freaky math geeks amaze me! That you can even figure out how to estimate this information is lake scary magic! I was officially too inept to help my son with third grade math this year — so I am beyond impressed with all that you do! I am grateful to have a resource in planning my trip! Even if it is off by a bit, it is still more information than I had before! Thank you!!!!!!
Our pleasure 🙂 Glad you found it useful. We like to hear how people use the calendar, its gives us sense of how to improve it.
Thanks for this analysis, Fred and the confirmation, Len. I always use the crowd calendar as a predictor when visiting WDW and have found it to be very accurate over the years. As noted, the crowd calendar has improved year to year as more data is collected. This increases my confidence that it will continue to closely mirror actuals. Bravo!
I was in Magic Kingdom on May 11 and May 14 and did not see Splash Mountain or Thunder Mountain with wait times greater than 20 minutes.On the 11th,we were in the parks from 9:00am until 4:30pm and rode both of these multiple times. Sometimes the wait was less! On the 14th we did an afternoon trip and were in the parks from 4:00pm until closing. These rides closed for part of the time due to inclement weather and the crowds stayed high for the 9pm parade. Wait times stayed around 5-15 minutes up until closing. If you think the rain changed the wait times, you should have seen the crowd leaving after the fireworks!
…and there’s an Unofficial Guide to Bars? We can’t be that smart if we didn’t sign up for that gig instead. 😛
Dibs on that research trip 🙂
Nice job, Fred. If I’ve done the math correctly, the calendar’s predictions average within +/- 5.1 minutes of what actually happens in the park. That’s an improvement from around +/-8 minutes last year.
I counted a difference of 108 minutes between what the actual wait times were, versus the crowd calendar’s range. So if we predicted an ‘8’ on one day, that’s a range of 75 to 84 minutes. An actual wait of 90 would mean an error of 6 minutes (90 actual – 84 predicted), and an actual wait of 70 would mean an error of 5 minutes (75 predicted – 70 actual). Because the crowd calendar only goes up to 10, I capped the error for any wait time > 100 minutes to whatever it would have taken to get the calendar to a 10 prediction.
Clearly this would just be a guess but do you think larger crowds in March and April that were unexpected could be a result of more students taking local vacations due to economy? Not that Disney is cheap but is cheaper for locals than getting on a plane and flying to, say, Europe or Mexico for Spring Break?
Its tough to say. There are so many factors at work in the “true” crowd model that its never usually just one thing.
Given all the variables, I think the crowd predictions are fantastic. Anyone complaining when they are off by a few needs to rethink the service you are providing. As mentioned, even Disney was taken by surprise in March.
I have to keep reminding myself that the index is based on 3 rides (1 of which is closed) in one park at PEAK TIMES. I personally don’t plan on being in the park when the peak wait times happen…..thanks to the UG!
Additionally, I wonder how Space Mountains’ closure in Magic Kingdom affects the corresponding ESTIMATE for the other parks. For example, would a 9 at Magic Kingdom (with Space Mountain closed) more closely correlate to an 8 or even a 7 at other parks?
Keep up the good work! We will be arriving on Saturday May 23rd for 11 days. First time using the UG and touring plans. Hopefully, I will have nothing but pleasant reports when we return.
It’s true, its all about the 3 rides at peak times. I sometimes wonder why the crowd calendar gets so much attention. In terms of beating crowds we already have the holy grail; customized, optimal Touring Plans! Picking a day that had crowds rated 9 versus 8 is immaterial when the touring plan saves you so much time on either day.
Mixed messages I know, “Here’s a crowd calendar…but you don’t really need it”. Some day I will write an article showing through simulation, the savings of a touring plan compared to picking days.
Glad to see your keeping your sense of humor. I was very interested to see how the first half of August was reduced on the calendar while the second half stayed virtualy the same. I’m guessing that this corresponds to the beginning of the free dining plan. Historicaly I was always led to believe that late August was better than early August. Guess I’ll find out when I’m down there. Thanks for all your hard work Fred.