Walt Disney World Crowd Report – December 8 to 14, 2013
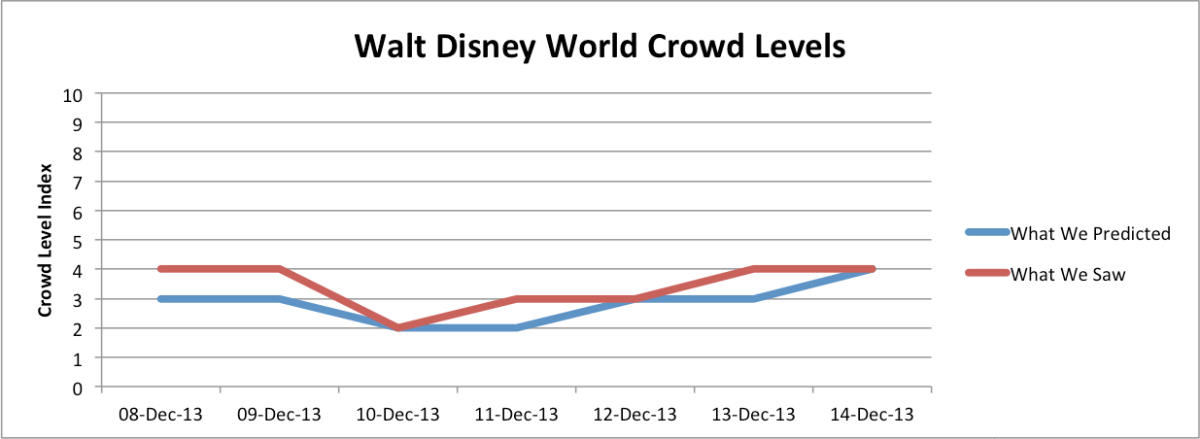
Our wait time models tell us that we should expect our predictions to be accurate within one or two index points most of the time. Occasionally we can expect to be off by three index points, but almost never more than that. On our previous crowd report we saw a couple days where our predictions missed by three index points. This week, we returned to form with a good week of predictions. Our resort-wide crowd levels were spot on three days and only missed by one the other four. Every park prediction of the week was within one or two index points.
It was a good week for visitors to the parks, too. Resort-wide crowd levels were below average all week, and each park stayed at a level ‘5’ or lower. Still, popular attractions did reach average wait times in the 80 to 90 minute range on some days. The new holiday-themed version of Jungle Cruise at Magic Kingdom continues to see a bump in interest, while most other attractions stayed within expected ranges all week.
Let’s look at how the crowd levels stacked up day-to-day.
| December 8 to 14, 2013 |
|---|
On Sunday all parks were below average except for the Animal Kingdom which reached a level ‘5’ on our scale. This was two levels higher than the ‘3’ we predicted thanks to higher than expected wait times at Kilimanjaro Safaris (31 minutes) and Dinosaur (22 minutes). Resort wide the wait times were below average reaching a level ‘4’. Each of the other three parks reached a level ‘4’ as well although in each case that was one level higher than predicted.
On Monday, the resort wide crowd level was ‘4’ again, one level higher than the ‘3’ that was predicted. Magic Kingdom and The Studios had wait times higher than expected although not significantly so. Our estimates for wait times at Epcot and Animal Kingdom were accurate within 5 minutes on average. The holiday re-theming of Magic Kingdom’s Jungle Cruise (dubbed “Jingle” Cruise) continues to draw more guests than usual, although the average posted wait time stayed below 50 minutes on Monday.
As predicted, Tuesday brought the lowest crowds of the week with all parks at a crowd level ‘2’ or lower. That doesn’t mean that the parks were empty however. Average posted wait times were 89 minutes at Toy Story Mania, 48 at Soarin’, 26 at Kilimanjaro Safaris and 36 minutes at Peter Pan’s Flight. Epcot’s wait times were the only surprise coming in a few minutes lower than expected, a surprise given Epcot hosted Extra Magic Hours in the morning.
Predictions for Epcot, The Studios and Animal Kingdom were accurate within one index point, the Magic Kingdom came in 2 points higher than predicted but still lower than average at a ‘4’. The higher wait times were spread out evenly amongst the attractions but average posted waits never exceeded more than 44 minutes. These times were reasonable for a day at the Magic Kingdom without a Very Merry Christmas Party.
Mickey’s Very Merry Christmas Party returned to the Magic Kingdom on Thursday while the park also hosted Extra Magic Hour morning. It was a good day if you took advantage of either event because the park came in at a level ‘2’. Resort-wide our prediction of a level ‘3’ hit the mark although each park prediction missed by one. Epcot was one higher at ‘4’, The Studios one lower at ‘2’ and the Animal Kingdom one higher than predicted at a level ‘3’.
The second Friday-the-13th of the season brought wait times that were almost exactly what we predicted. Our predictions were accurate for The Magic Kingdom (3), Epcot (5) and Animal Kingdom (3). Only The Studios missed the mark but by one index level. We predicted a ‘2’ and wait times came in at a ‘3’.
Saturday brought the end to the Pop Warner Football Championship at Wide World of Sports. It also brought accurate predictions by our models with matches for the resort-wide level, Magic Kingdom and Epcot while The Studios came in one level higher than expected and Animal Kingdom one level lower. All parks were at a level ‘5’ or below as predicted.
| December 15 to 21, 2013 |
|---|
Below average crowds are expected this coming week as well as we approach the busiest season of the year at Walt Disney World. We are predicting this coming week to be the calm before the storm with wait times continuing to be about average. Saturday, December 21, will be the day when Christmas guests start to arrive at the resort with the corresponding bump in attendance at the parks occurring the following day. We project relative wait times to be the highest at Epcot this coming week. Crowds at the Magic Kingdom will continue to fluctuate around the schedule of Mickey’s Very Merry Christmas Parties.
To see Walt Disney World Crowd predictions for the days of your vacation, check the Crowd Calendar.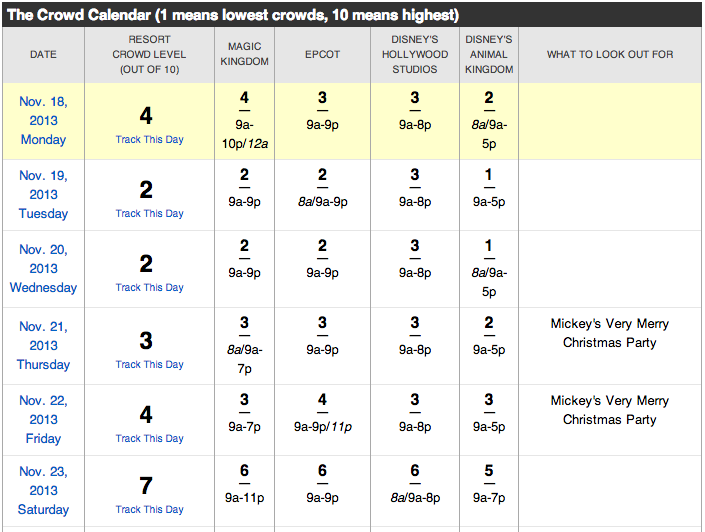
The separately ticketed Mickey’s Very Merry Christmas Party continues on many nights at Magic Kingdom, which means savvy planners who don’t mind the shortened park hours can experience low wait times during the day.![]()
To get details about our predictions of future crowds or details about crowds in the past check out the Crowd Calendar and select “Jump to Date” on the left margin.
You May Also Like...
-

This weekend will have the longest park hours since Walt Disney World re-opened in July. Extended park hours are a signal…
-

The December Crowd Calendar update is now live. We are in the busiest time of year at Walt Disney World. During…
-
The February 2020 Crowd Calendar update is now live. So far 2020 is showing increased crowds at Walt Disney World. We…
-
The October Crowd Calendar update is now live. We skipped September to give the models a chance to digest the data with Star…
Fred, I just want to commend you and the Touring plans team on your work. These weekly updates are informative and helpful for unlocking the ‘mysteries’ of attendance patterns at WDW. It is also helpful to hear your analysis of your own predictions for what went right or wrong or both in nearly real time. That alone sets Touring Plans apart and is incredibly useful to consumers who are planning their WDW vacations.