Walt Disney World Crowd Report – December 15 to 21, 2013
Our predictions did well again this week with no major misses. The past week will be the last time crowds stay below average in 2013.
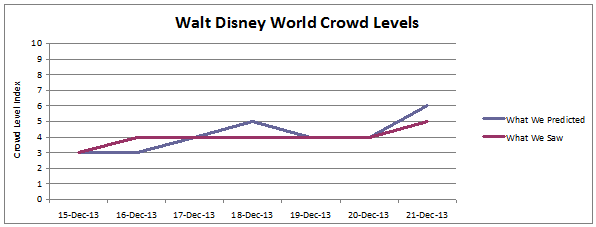
Let’s look at how the crowd levels stacked up day-to-day.
![]()
| December 15 to 21, 2013 |
|---|
On Sunday all parks had wait times much lower than average with no park exceeding a level ‘3’ on our scale. Magic Kingdom and Animal Kingdom only reached level ‘2’. This matched our predictions where we expected the resort wide level to be ‘3’ and each park to be a level ‘4’ or lower. No prediction missed by more than one index level.
The resort wide crowd level did reach a level ‘4’ on Monday led by a level ‘5’ at Magic Kingdom, as predicted. The Studios was the only surprise with wait times reaching a level ‘4’ on our scale despite the level ‘1’ predicted. We expected wait times to average 57 minutes at Toy Story Mania, 33 at Rock ‘n’ Roller Coaster and 12 at Tower of Terror. Instead we saw averages of 77, 47 and 39 minutes respectively. Meanwhile, average wait times at Star Tours (17 minutes) and Great Movie Ride (13 minutes) matched predictions.
Predictions proved accurate all around the resort on Tuesday. Observations matched the predictions for the resort-wide crowd level (4), Magic Kingdom (2) and The Studios (3) while Epcot and Animal Kingdom predictions only missed by one. Tuesdays seem to be leading the way for low wait times in December, although crowds have remained below average most days all month.
Crowds continued to stay below average on Wednesday, although we had predicted that Magic Kingdom and Epcot would reach a level ‘6’. Magic Kingdom came in two levels lower while Epcot missed by three. Epcot’s low wait times were park wide with each attraction averaging posted wait times 10 to 15 minutes lower than expected with the exception of Mission: Space (green).
No surprises on Thursday where the resort wide crowds hit a level ‘4’ as predicted. Only The Studios missed by more than one index level with average wait times reaching a ‘4’ on our scale, we predicted ‘2’. This was driven mostly by higher wait times at Rock ‘n’ Roller Coaster and Tower of Terror with average posted times of 61 and 35 minutes respectively. Still, these wait times are below average for the year.
We almost had a clean sweep of accurate predictions on Friday. Every prediction hit the mark except for Magic Kingdom where we overpredicted by one index point. Epcot did hit a level ‘6’ as predicted on Friday which is the first time all week we saw wait times hit above average.
Our expectation that holiday guests would start to roll in on Saturday seems premature. We over-predicted at each park except Magic Kingdom which did reach a level ‘6’. We missed by two index levels at Epcot and Animal Kingdom which came in at levels ‘5’ and ‘4’ respectively. Some difficult travelling weather in the mid-West and North-East may have delayed the arrival of some holiday guests.
| December 22 to 28, 2013 |
|---|
There are no more definitive predictions of the year than those for this coming week. Crowds will build sharply starting Monday the 23rd and Tuesday the 24th but even those days will pale in comparison to the capacity crowds that influx to the parks starting December 26th. If you are arriving this week, get as much touring done as you can before December 28th because that is when the real crowdedness begins. Arrive early, use our holiday touring plans and expect extreme crowds.
To see Walt Disney World Crowd predictions for the days of your vacation, check the Crowd Calendar.
![]()
To get details about our predictions of future crowds or details about crowds in the past check out the Crowd Calendar and select “Jump to Date” on the left margin.
You May Also Like...
-

The December Crowd Calendar update is now live. We are in the busiest time of year at Walt Disney World. During…
-

This weekend will have the longest park hours since Walt Disney World re-opened in July. Extended park hours are a signal…
-
This Crowd Calendar update is an update through May 2021. The slight delay in publishing this month's update due to us wanting…
-
The February 2020 Crowd Calendar update is now live. So far 2020 is showing increased crowds at Walt Disney World. We…