Walt Disney World Crowd Report – January 19 to January 25, 2014
Our expectation that Martin Luther King Jr. holiday crowds would flatten out by Wednesday turned out to be correct last week. The parks stayed at or below average most of the week after the holiday with only a few exceptions. Predictions were accurate within our expectations although Tower of Terror at The Studios showed possible signs of operational issues. We have seen that during periods of low attendance Tower of Terror might shut down one elevator shaft thereby inflating the posted wait times.
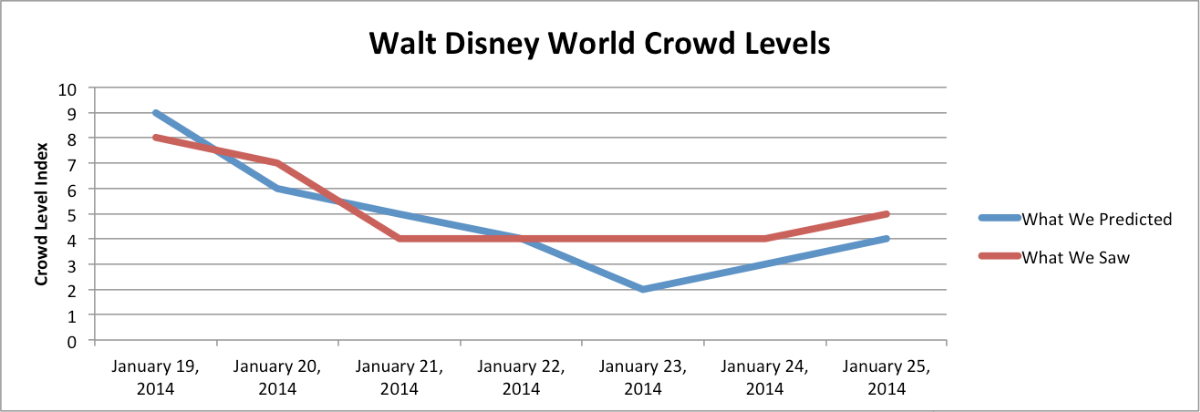
Let’s look at how the crowd levels stacked up day-to-day.
| January 19, 2014 to January 25, 2014 |
|---|
As predicted, crowds on Sunday represented the peak of the Holiday weekend with a resort-wide level ‘8’ on our scale. Magic Kingdom was the only park that didn’t reach a level ‘8’ even though it hosted Extra Magic Hour Evening. It was a ‘7’ thanks to slightly lower than expected waits at most attractions. Even The Studios hit a level ‘8’ despite our prediction of ‘5’ although Star Tours and Rock ‘n’ Roller Coaster both had wait times higher than expected.
Crowds faded slightly on Holiday Monday compared to the weekend. Resort-wide we observed a level ‘7’ on our scale. Magic Kingdom and Epcot were a ‘6’ while The Studios hit one level higher (7) and Animal Kingdom, which hosted Extra Magic Hour morning, one level higher still (8). We predicted a level ‘6’ at Animal Kingdom but it was higher than expected wait times at Kilimanjaro Safaris (57 minutes, we predicted 44) and Kali River Rapids (17 minutes, we predicted 11) that pushed the park level up two notches.
Tuesday’s crowds were significantly lighter as the Holiday rush subsided. The Studios hit lower than expected wait times with a park level ‘3’, we predicted ‘6’. Elsewhere, our predictions were accurate within 1 index level including a resort-wide level ‘4’, we predicted ‘5’. Magic Kingdom was a ‘6’ (predicted ‘5’), Epcot a ‘5’ (predicted ‘6’) and Animal Kingdom a ‘3’ as predicted. Interestingly, Tower of Terror peaked 20 minutes higher than we predicted although all other attractions at The Studios were lower than expected. This may be an indication that only one of Tower of Terror’s elevator shafts was operational for part of the day.
Lower than average crowds continued on Wednesday including a level ‘3’ at Magic Kingdom (we predicted ‘5’). The resort-wide crowd level was a ‘4’ as predicted while at the other parks we saw ‘4’s all-around as well. For reference, the level ‘3’ at Magic Kingdom included a 42-minute average at Peter Pan’s Flight, a 31-minute average at Big Thunder Mountain Railroad and a 7-minute average at Pirates of the Caribbean. Be careful when you see a low crowd level on our scale, it doesn’t mean that the parks are empty, only that the wait times are below average. In some cases, those averages can be very high.
We expected a dip in resort-wide crowds on Thursday that didn’t quite happen although we did have below average wait times at Epcot, The Studios and Animal Kingdom as predicted. We predicted Magic Kingdom to have the highest level while it hosted Extra Magic Hour morning which turned out correct (level ‘5’). Both Epcot (3) and The Studios (4) came in two levels higher than predicted. Again, Tower of Terror had much higher than expected wait times (71 minutes, predicted 29) making us suspicious that one shaft may have been affected.
Our predictions of ‘3’ at The Studios and Animal Kingdom were accurate on Friday. The Magic Kingdom was a ‘4’, two levels lower than predicted while Epcot came in one level higher than predicted (5). Resort-wide we saw no park reach a level above average so the lower crowds of late January seem to be continuing.
Only Animal Kingdom peaked above average on Saturday with a level ‘6’ (we predicted ‘4’). Magic Kingdom (predicted ‘6’) and The Studios (predicted ‘3’) both reached a level ‘5’ on our scale while Epcot stayed below average at a level ‘4’, as predicted. Tower of Terror did have an average posted time higher than expected but not significantly so. We expected an average of 26 minutes but observed an average of 36.
| January 26 to February 1, 2014 |
|---|
Late January continues to be a perennial low for Walt Disney World crowds. The first holiday bump in attendance is complete and we expect below average wait times until the next bump in attendance which will arrive mid-February. The NFL’s Super Bowl weekend is being hosted in the North East so we expect crowds at Disney parks to be unaffected.
To see Walt Disney World Crowd predictions for the days of your vacation, check the Crowd Calendar.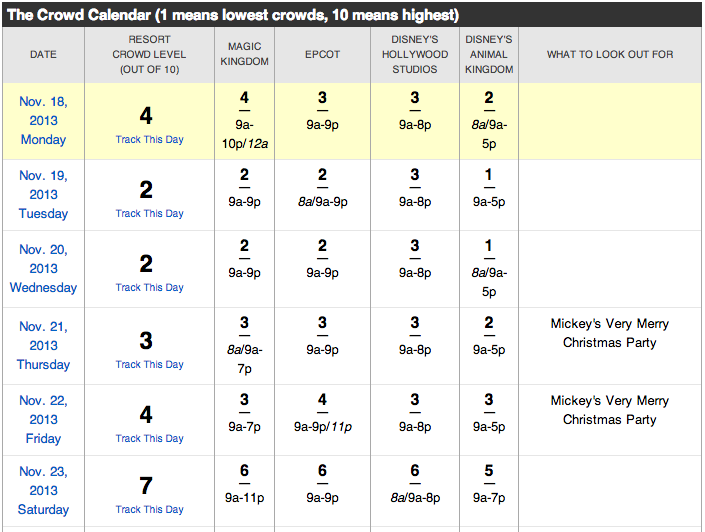
![]()
To get details about our predictions of future crowds or details about crowds in the past check out the Crowd Calendar and select “Jump to Date” on the left margin.
You May Also Like...
-

This weekend will have the longest park hours since Walt Disney World re-opened in July. Extended park hours are a signal…
-

The February 2020 Crowd Calendar update is now live. So far 2020 is showing increased crowds at Walt Disney World. We…
-

A new Disney Visa discount offer for Walt Disney World vacations has just been released. Here's the details: This offer is…
-

Although nuiMOs may have taken the spotlight for some, Wishables continue to be a popular mini plush at Walt Disney World.…
My family went to the parks on the 21st-24th, MK, EP, HS, AK, in that order. I used my own custom made touringplans for each day that I developed here at the site and followed them pretty much without problem, even with an 11 month at my side. The weather was nippy the last three days, but much better than the teens back home in MD.
Overall, I only had to wait in excess of the time it took to walk to the loading area + maybe 2 groups in each docking terminal in front of me on two rides total (at all four parks). I hit the Jungle Cruise around 11am and had to wait about 20 minutes, and later in the day, since we decided to forgo staying after the MSEP and Castle Show, we hit up Winnie the Pooh about 6:15pm and had to wait about 25 minutes (which is not a bad wait because there is soo much to do.
This was my first time using a TP and I must say, it was awesome. I can’t remember how many times my sister, wife or myself said, “Man I am glad we went on that earlier”, or , “Man am I glad we have a fast pass”, as we walked past massive waits later in the day. The only rides we did not get to do were Buzz Lightyear and Little Mermaid at MK (+ some random shows we were not interested in), then again we left at about 8:15pm. At all the other parks we were able to do everything by 6pm at the latest and get our infant back to the WDW Resort hotel early. Note that we arrived at or slightly before the parks opened each day.
FYI, on Thursday at HS, Tower was closed for the first 2-3 hours, waits were over 100 minutes each time I passed the attraction for the rest of the day. I think it had more to do with people having three less hours to ride it than cars being broken. They looked to all be loading when I used my FP+ on the ride. Though I could be wrong.
Hi, I have a general question about the crowd calendar – I was using it to plan an upcoming trip Mar 4-14 and I noticed the crowd levels having dropped 2 from between 6-8 to between 4-6. While these new levels make me VERY HAPPY, I’m curious what circumstances prompted these adjustments?