Walt Disney World Crowd Report – January 26 to February 1, 2014
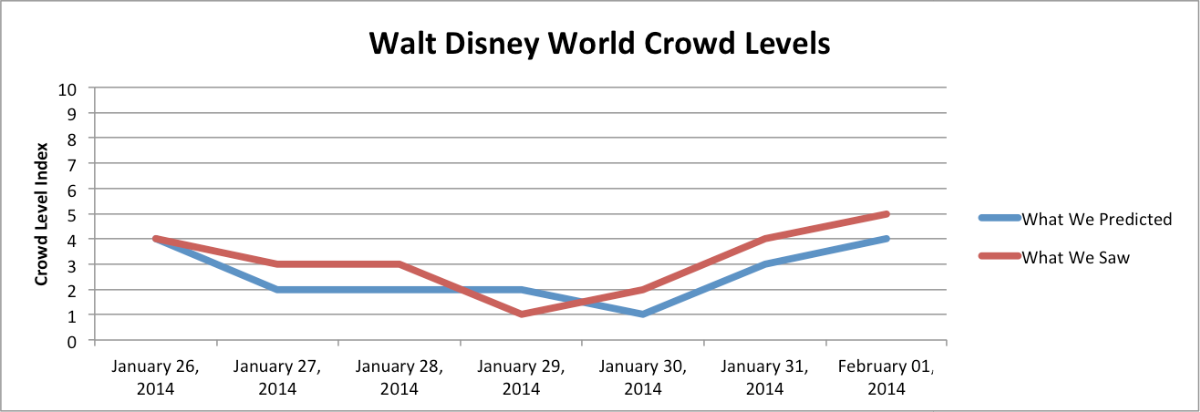
Our predictions performed very well this week with no predictions missing by more than 2 index points. Crowds were very light with the resort-wide numbers staying below average all week as predicted until Saturday when we saw a level ‘5’.
Let’s look at how the crowd levels stacked up day-to-day.
| January 26, 2014 to February 1, 2014 |
|---|
Magic Kingdom had the highest crowd level of the four parks on Sunday although it stayed at a level ‘5’ on our scale. Pirates of the Caribbean was the only surprise at the flagship park with a 24-minute average posted time, 5 minutes higher than expected. Big Thunder was less crowded than expected with only a 35-minute average. Epcot and The Studios came in as the least crowded parks at a level ‘3’ while Animal Kingdom was in the middle with a level ‘4’.
Animal Kingdom reached a level ‘2’ on Monday and that was the only crowd level that wasn’t a ‘3’. Resort-wide we had a ‘3’ as well as at Magic Kingdom, Epcot and The Studios. Our predictions were all accurate within 1-index level except for Epcot where we had predicted a ‘1’. Most of the park was a level ‘1’ but Mission: Space (Green) had posted times that averaged 23 minutes between 10am and 5pm, much higher than normal for an off-season day. If you visited Epcot on Monday you should have been able to tour very efficiently.
Three (3) was the number of the day on Tuesday as well with all crowd levels coming in at a level ‘3’, this time including Animal Kingdom. The only attractions that averaged higher than our predictions were Test Track at Epcot (58 minutes, predicted 30) and Tower of Terror (26 minutes, predicted 18).
In retrospect, Wednesday’s crowd levels may have been the least crowded day of the last 12 months. We predicted ‘1’s and ‘2’s across the resort and that is exactly what happened. In fact, all parks were a level ‘1’ with Epcot as the only exception, a level ‘2’. A resort-wide level ‘1’ is a relatively rare event on our Crowd Calendar, normally reserved for low crowds of September, early January or days with particularly poor weather. Wednesday’s Extra Magic Hour morning at Animal Kingdom was so un-crowded that no attraction averaged posted times more than 15 minutes!
Despite Thursday’s cool temperatures, crowds were slightly more crowded than Wednesday. Still very much below average however, with no level reaching higher than ‘2’. Animal Kingdom stayed at a level ‘1’ again and even the Extra Magic Hour morning at Magic Kingdom wasn’t enough to push average posted times above 40 minutes (Peter Pan’s Flight – 40 minutes). Space Mountain averaged 16 minutes and Big Thunder 23 minutes.
Crowds started to build on Friday as predicted, with Magic Kingdom averaging posted times high enough for a level ‘6’ on our scale. Epcot was the second most crowded park at a level ‘4’ while The Studios and Animal Kingdom remained uncrowded at a level ‘2’. Toy Story Mania averaged 63 minutes on Friday, one of the lowest averages you’ll see all year at that attraction.
Saturday brought the highest resort-wide crowd level of the week, a level ‘5’ on our scale with the highest wait times of the week for Animal Kingdom (6), The Studios (5) and Magic Kingdom (5). Saturday was the only day this week where we missed two predictions by more than one level. We predicted a 4 at Animal Kingdom and a 3 at The Studios.
| February 2 to 8, 2014 |
|---|
Presidents Day week at Walt Disney World will bring large crowds to the resort, starting around Valentine’s Day on Friday, February 14th. Between now and then we expect the low crowds to continue with ‘1’s, ‘2’s and ‘3’s dominating the calendar in the first half of February.
To see Walt Disney World Crowd predictions for the days of your vacation, check the Crowd Calendar.
![]()
To get details about our predictions of future crowds or details about crowds in the past check out the Crowd Calendar and select “Jump to Date” on the left margin.
You May Also Like...
-

This weekend will have the longest park hours since Walt Disney World re-opened in July. Extended park hours are a signal…
-
The April Crowd Calendar update only has minor changes. We are halfway through spring break, and crowd levels have been in-line…
-
Crowds have mostly been low so far for 2021. We expect the week of President's Day and Mardi Gras will be…
-
Today the Universal Crowd Calendar gets a refresh. Lately, the crowd levels at Universal Studios have been two or more points…
I was at Magic Kingdom on the 29th and it was ridiculously quiet, I have never seen it so empty! This was us in the morning after riding a couple things!! https://twitter.com/virtualgill/status/428560599099113472