Walt Disney World Crowd Report – March 2 to March 8, 2014
Last week we saw higher crowds earlier in the week and lower crowds later, including a storm-filled Thursday that kept many guests from venturing to the parks. Our predictions stayed within expected error ranges all week. We are preparing for an update to the calendar in reaction to some park hour changes, Fastpass + and some improvements in our statistical models. Watch for the update early in the week. To be notified if the calendar changes for your dates of your travel use the Crowd Tracker.
Let’s look at how the crowd levels stacked up day-to-day last week.
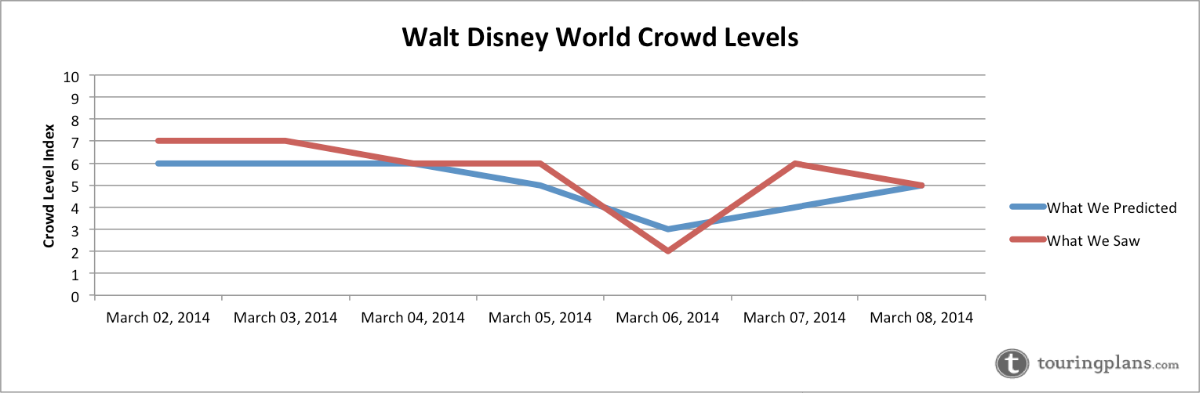
| March 2, 2014 to March 8, 2014 |
|---|
Crowds came in slightly higher than expected at Epcot (a ‘6’, predicted ‘5’), The Studios (a ‘6’, predicted ‘5’) and Animal Kingdom (an ‘8’, predicted ‘6’). Our prediction of a level ‘7’ at Magic Kingdom was correct with most attractions hitting our targets within 3 to 10 minutes. For example, Peter Pan’s Flight’s average posted time was 62 minutes, we predicted 63. Buzz Lightyear’s Space Ranger Spin had an average posted time of 34 minutes, we predicted 38.
The observed crowds on Monday were very similar to Sunday. Slightly higher than predicted at The Studios and Animal Kingdom while slightly lower at Magic Kingdom and Epcot. Warm weather pushed the wait time higher at Animal Kingdom’s Kali River Rapids which had an average posted time of 42 minutes, we predicted 12. However, our predictions at Dinosaur, Expedition Everest and Primeval Whirl were all within a few minutes of what we observed.
Resort-wide, our prediction of a level ‘6’ on Tuesday was accurate however the two Kingdoms were both two levels higher than expected. We saw a surprisingly high level ‘8’ at Magic Kingdom and a level ‘7’ at Animal Kingdom. The higher wait times at Magic Kingdom were spread out fairly evenly amongst the attractions. We saw average posted times of 62 minutes at Big Thunder Mountain Railroad (predicted 46), 37 at Pirates of the Caribbean (predicted 27) and 36 at Haunted Mansion (predicted 26).
Once again our attraction predictions on Wednesday were solid across the resort. The only exceptions were at Epcot this time where we missed by two (a ‘7’, predicted ‘5’) thanks to high average waits at Spaceship Earth (20 minutes, predicted 13) and Mission: Space (33 minutes, predicted 10). We did well at Magic Kingdom on Wednesday with only two attractions missing by more than 10 minutes.
Storms that prompted a tornado watch at Orlando International Airport on Thursday also kept crowds very low around Walt Disney World. Magic Kingdom only reached a level ‘2’ on Thursday, despite hosted Extra Magic Hour morning. Epcot was the only park that had a crowd level higher than we predicted but even that park only reached a level ‘4’. Storms seem to affect Animal Kingdom more than any other park likely because the popular attractions are exposed to inclement weather. Despite reaching levels as high as ‘7’ earlier in the week, Animal Kingdom was a ‘1’ on Thursday.
Perhaps the most significant effect of Thursday’s storms was the influx of guests to the parks on Friday. Resort-wide, our prediction of ‘4’ ended up two levels too low. The Studios crowds did match our prediction at a level ‘4’ but Epcot and Animal Kingdom came in at a level ‘6’ despite our prediction of ‘4’. Magic Kingdom wasn’t too bad at a level ‘7’, one higher than predicted, within our expected error.
Saturday we had the resort-wide number right but it was a result of a mismatch at Epcot and The Studios. We under-predicted Epcot by two (predicted ‘4’, was a ‘6’) and over-predicted The Studios by three (predicted ‘6’, was a ‘3’) which is surprising given that The Studios hosted Extra Magic Hour morning on Saturday.
| March 9 to 15, 2014 |
|---|
The start of spring break is upon us and crowds around Walt Disney World will increase accordingly. We still like March as a time of year to visit however. The weather is nice and although crowds are larger than January and February they are easily manageable with a good touring plan.
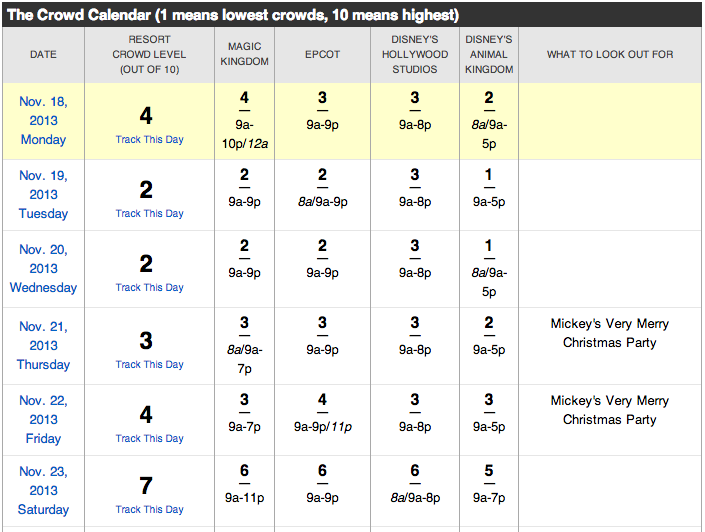
To see Walt Disney World Crowd predictions for the days of your vacation, check the Crowd Calendar.![]()
To get details about our predictions of future crowds or details about crowds in the past check out the Crowd Calendar and select “Jump to Date” on the left margin.
You May Also Like...
-

This weekend will have the longest park hours since Walt Disney World re-opened in July. Extended park hours are a signal…
-

Disney has shared another update regarding operational changes to Walt Disney World due to Coronavirus. 5 p.m. on Friday March 20,…
-
We have been holding off on doing any big Crowd Calendar updates until we saw how the crowds were in 2021.…
-

The February 2020 Crowd Calendar update is now live. So far 2020 is showing increased crowds at Walt Disney World. We…