Disney World Crowd Report – June 22 to 28, 2014
Most school districts have completed the 2013-2014 school year now although crowds are still trending slightly lower than history would suggest. We saw few instances with wait times higher than predicted. Star Tours and other Studios attractions continue to operate with lower demand than usual.
Let’s look at the Disney World Crowd Report to see how the crowd levels stacked up each day last week:
| WHAT WE THOUGHT |
WHAT WE SAW |
ANALYSIS | |
|---|---|---|---|
| Magic Kingdom |
7
|
6
|
The lucky number on Sunday was ‘6’, with all parks hitting a level ‘6’ except for The Studios. Star Tours was the big surprise on Sunday with an average wait time of 16 minutes (predicted 26). A 16 minute average posted time at Star Tours represents a ‘1’ on our scale. Star Tours continues to operate at a capacity higher than its demand. |
| Epcot |
5
|
6
|
|
| Hollywood Studios |
6
|
4
|
|
| Animal Kingdom |
7
|
6
|
|
| WHAT WE THOUGHT |
WHAT WE SAW |
ANALYSIS | |
| Magic Kingdom |
7
|
7
|
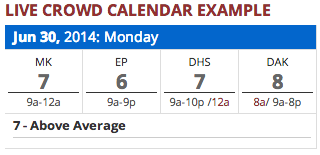
Monday’s crowds were lower than expected except for Magic Kingdom. Our estimates at Magic Kingdom continue to perform very well with no predictions missing by more than two index levels (only Big Thunder Mountain Railroad and Peter Pan’s Flight missed by two). Although Animal Kingdom was not as bad as predicted it was still the busiest park. |
| Epcot |
6
|
5
|
|
| Hollywood Studios |
7
|
5
|
|
| Animal Kingdom |
9
|
7
|
|
| WHAT WE THOUGHT |
WHAT WE SAW |
ANALYSIS | |
| Magic Kingdom |
8
|
7
|
Crowds went up a notch as predicted on Tuesday. Epcot was the most crowded with Test Track reaching an average posted time of 103 minutes. Perhaps even more telling is Spaceship Earth’s average posted time of 31 minutes, a definite ’10’ out of ’10’ for that attraction. |
| Epcot |
9
|
9
|
|
| Hollywood Studios |
8
|
5
|
|
| Animal Kingdom |
9
|
8
|
|
| WHAT WE THOUGHT |
WHAT WE SAW |
ANALYSIS | |
| Magic Kingdom |
7
|
7
|
We correctly predicted another crowd level ‘9’ on Wednesday, this time at Animal Kingdom. Kali River Rapids had an average posted time of 65 minutes, a ’10’ on its scale while Expedition Everest stayed about average at 33 minutes. Dinosaur was very busy at a 41-minute average posted time. Star Tours continues to underwhelm with an average wait of 20 minutes, the lowest of the headliners by 40 minutes. |
| Epcot |
6
|
7
|
|
| Hollywood Studios |
8
|
6
|
|
| Animal Kingdom |
9
|
9
|
|
| WHAT WE THOUGHT |
WHAT WE SAW |
ANALYSIS | |
| Magic Kingdom |
7
|
7
|
Slightly smaller crowds on Thursday although no park dipped below the average, ’5’. Pirates of the Caribbean reached an average posted wait of 34 minutes which is as crowded as it gets for that attraction while most other Magic Kingdom attractions stayed closer to the park wide level, ‘6’. |
| Epcot |
7
|
5
|
|
| Hollywood Studios |
7
|
6
|
|
| Animal Kingdom |
8
|
7
|
|
| WHAT WE THOUGHT |
WHAT WE SAW |
ANALYSIS | |
| Magic Kingdom |
7
|
6
|
Toy Story Mania (81 minutes, predicted 106) and Tower of Terror (50 minutes, predicted 79) put The Studios crowd level two lower than expected although our estimates for Great Movie Ride and Star Tours were within one minute of their predicted average. Animal Kingdom wasn’t so bad either where the highest average wait was 54 minutes at Kali River Rapids. |
| Epcot |
7
|
7
|
|
| Hollywood Studios |
7
|
5
|
|
| Animal Kingdom |
8
|
6
|
|
| WHAT WE THOUGHT |
WHAT WE SAW |
ANALYSIS | |
| Magic Kingdom |
5
|
6
|
Lower crowds than expected at every park except Magic Kingdom. The first time of the week we missed a crowd level by 3 index points (Studios and Animal Kingdom). Epcot’s numbers were only slightly lower than predicted with only Soarin’ and Test Track missing by more than 20 minutes. |
| Epcot |
5
|
4
|
|
| Hollywood Studios |
7
|
4
|
|
| Animal Kingdom |
8
|
5
|
|
| June 29 to July 5, 2014 |
|---|
School is out and summer crowds begin! July 4th is one of the busiest days at Walt Disney World, chances are good that Magic Kingdom will reach capacity at some part of the day. Although still very crowded, The Studios is a great choice for July 4th festivities if you are looking to minimize crowds.
To see Walt Disney World Crowd predictions for the days of your vacation, check the Crowd Calendar.![]()
To get details about our predictions of future crowds or details about crowds in the past check out the Crowd Calendar and select “Jump to Date” on the left margin.
You May Also Like...
-

This weekend will have the longest park hours since Walt Disney World re-opened in July. Extended park hours are a signal…
-
The April Crowd Calendar update only has minor changes. We are halfway through spring break, and crowd levels have been in-line…
-

June is here, and it is time for another Crowd Calendar update. Disney introduced a new summer One World Ticket. The…
-
We have been holding off on doing any big Crowd Calendar updates until we saw how the crowds were in 2021.…
I got this web site from my buddy who shared with me on the topic of this
web page and at the moment this time I am visiting this website
and reading very informative articles or reviews at this place.