Disney World Crowd Report – August 24 to August 30, 2014
By far, the least crowded season of the year is the period between Labor Day and mid-September. Schools are back in session and most families have completed their summer vacations. Judging by last week’s crowd numbers that September lull may have begun a week early. We saw very low wait times across the resort.
Let’s look at how the crowd levels stacked up each day last week on the TouringPlans.com Disney World Crowd Report:
| WHAT WE THOUGHT |
WHAT WE SAW |
ANALYSIS | |
|---|---|---|---|
| Magic Kingdom |
4
|
2
|
Crowd levels were all below average as expected on Sunday. Magic Kingdom was the lowest with the other parks not far behind. Haunted Mansion (20 minutes), Jungle Cruise (18) and Winnie the Pooh (22) hit their lowest point on our 1 to 10 scale. |
| Epcot |
2
|
3
|
|
| Hollywood Studios |
4
|
4
|
|
| Animal Kingdom |
4
|
3
|
|
| WHAT WE THOUGHT |
WHAT WE SAW |
ANALYSIS | |
| Magic Kingdom |
4
|
4
|
Our predictions of ‘4’ at Magic Kingdom and Epcot and of ‘2’ at Animal Kingdom hit the mark. Only The Studios fell outside normal range with a 22 minute average posted time at Great Movie Ride as well as 72 minutes at Toy Story Mania. Star Tours also hit a healthy 24 minute average. |
| Epcot |
4
|
4
|
|
| Hollywood Studios |
4
|
6
|
|
| Animal Kingdom |
2
|
2
|
|
| WHAT WE THOUGHT |
WHAT WE SAW |
ANALYSIS | |
| Magic Kingdom |
3
|
3
|
Tuesday’s crowd at Epcot was the first sign that the Septmeber lull in attendance may have been occurring early this year. Test Track averaged 52 minutes, well below expected although Spaceship Earth hit 16 minutes, exactly as we predicted. |
| Epcot |
6
|
2
|
|
| Hollywood Studios |
3
|
4
|
|
| Animal Kingdom |
3
|
1
|
|
| WHAT WE THOUGHT |
WHAT WE SAW |
ANALYSIS | |
| Magic Kingdom |
4
|
1
|
More signs of lower than expected crowds on Wednesday. All parks came in two or more levels lower than history would suggest. Many attractions hit a level ‘1’ on our scale, especially at Magic Kingdom, an occurrence that is normally reserved for the week after Labor Day. |
| Epcot |
4
|
2
|
|
| Hollywood Studios |
5
|
3
|
|
| Animal Kingdom |
6
|
2
|
|
| WHAT WE THOUGHT |
WHAT WE SAW |
ANALYSIS | |
| Magic Kingdom |
3
|
2
|
Our predictions of ‘3’ or lower at Magic Kingdom, The Studios and Animal Kingdom were within range but Epcot’s crowd was unbelievably low. Test Track averaged 43 minutes, Spaceship Earth 10, Soarin’ 34 and Living with the Land 2, all the lowest on our scale. |
| Epcot |
6
|
1
|
|
| Hollywood Studios |
3
|
1
|
|
| Animal Kingdom |
2
|
1
|
|
| WHAT WE THOUGHT |
WHAT WE SAW |
ANALYSIS | |
| Magic Kingdom |
3
|
1
|
Ones across the board (except for The Studios at ‘2’) are another sign of the Labor Day lull in attendance arriving early this year. No headliner attraction resort-wide went above a level ‘3’ on our scale – and the most common level by far was ‘1’. |
| Epcot |
5
|
1
|
|
| Hollywood Studios |
4
|
2
|
|
| Animal Kingdom |
2
|
1
|
|
| WHAT WE THOUGHT |
WHAT WE SAW |
ANALYSIS | |
| Magic Kingdom |
3
|
4
|
Predictions returned to normal performance on Saturday with only one park (Magic Kingdom) missing the mark, slightly. We predicted Soarin’ would average a posted time of 49 minutes and we observed exactly that. |
| Epcot |
2
|
2
|
|
| Hollywood Studios |
4
|
4
|
|
| Animal Kingdom |
3
|
3
|
|
| August 31 to September 6, 2014 |
|---|
If last week was slow then imagine how quiet this week must be. By far, the number one best time of the year for low crowds is the week after Labor Day. The summer heat is still blazing however so be prepared to take breaks – not from the crowds but from the heat.
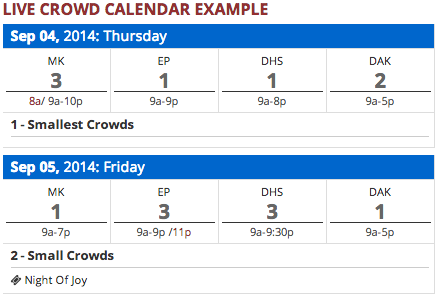
To see Walt Disney World Crowd predictions for the days of your vacation, check the Crowd Calendar.![]()
To get details about our predictions of future crowds or details about crowds in the past check out the Crowd Calendar and select “Jump to Date” on the left margin.
You May Also Like...
-

The August Crowd Calendar update is now live. Since the last update, Disney made some moves that have influenced our crowd…
-

This weekend will have the longest park hours since Walt Disney World re-opened in July. Extended park hours are a signal…
-
Today we are pushing a quick update to Crowd Calendar forecasts for Disneyland Resort. These are to reflect the lower weekend…
-
Crowded theme parks during the Christmas holiday are as certain as death and taxes. Every year we see crowd levels hit…
I was there last week also. We toured Animal Kingdom on the 28th, and I have never seen it with crowds that low. It was so pleasant to walk around without bumping into people! I love taking our vacation the week before Labor Day, it is such a slow time but the kids don’t have to miss school (we start the day after Labor Day).
I was there and Wednesday was the slowest day at the MK I can recall until the afternoon but we left for the day right after the 3:00 parade. Do you have anything that shows what the wait levels are for each level? I guess in my mind a 34 minute wait for Soarin’ feels higher than a 1. Maybe that’s why I feel like your off with your predictions.
Yes. Our crowd levels are based on wait times (which we can measure).
http://touringplans.com/epcot/crowd-levels
Many schools across the US are now starting classes the Monday before Labor Day. That may account for the early dip in attendance.