Universal Orlando Crowd Report – September 21 to 27, 2014
Last week, no park reached wait times higher than a level ‘4’ on our scale and most days stayed around a ‘2’ or ‘3’. That means posted wait times averaged 10 to 30 minutes at most attractions. September is low season at Universal Orlando so even the new Harry Potter attractions weren’t enough to push wait times to average levels for the year. Escape to Gringotts saw average waits in the range of 15 to 20 minutes some days, their lowest level since the attraction opened. Larger crowds are likely on their way however as we progress deeper into the fall season and approach Thanksgiving in November.
Let’s look at how the crowd levels stacked up each day last week on the TouringPlans.com Universal Orlando Resort Crowd Report:
| WHAT WE THOUGHT |
WHAT WE SAW |
ANALYSIS | |
|---|---|---|---|
| Universal Studios |
2
|
3
|
Low waits across the resort on Sunday despite the Early Park Admission at Universal Studios beginning at 7:00 am. only a few attractions hit average posted times high enough to reach a level ‘4’on our scale and none of our predictions missed by more than a few minutes. |
| Islands of Adventure |
3
|
2
|
|
| WHAT WE THOUGHT |
WHAT WE SAW |
ANALYSIS | |
| Universal Studios |
3
|
2
|
Monday’s crowds were about the same as Sunday’s if not slightly lower. Despicable Me: Minion Mayhem was the only headliner with substantial wait times. Rip Ride Rockit averaged a mere 15 minutes while over at Islands of Adventure we saw averages like 21 minutes (predicted 29) at Forbidden Journey. |
| Islands of Adventure |
4
|
2
|
|
| WHAT WE THOUGHT |
WHAT WE SAW |
ANALYSIS | |
| Universal Studios |
2
|
2
|
Even lower waits on Tuesday, including 17 minutes at Spider-Man (predicted 26) and 13 at The Incredible Hulk Coaster. Disaster! hit 16 minutes (predicted 15) and Despicable Me: Minion Mayhem averaged 38 minutes (predicted 39). |
| Islands of Adventure |
2
|
1
|
|
| WHAT WE THOUGHT |
WHAT WE SAW |
ANALYSIS | |
| Universal Studios |
2
|
2
|
The newness of an attraction at Universal Orlando seems to be a strong predictor of its wait time, more than other properties. Wait times at Hollywood Rip Ride Rockit (21), Despicable Me (37) and Transformers (27) dwarfed those at E.T. (10), Men In Black (11) and Revenge of the Mummy (8). |
| Islands of Adventure |
2
|
2
|
|
| WHAT WE THOUGHT |
WHAT WE SAW |
ANALYSIS | |
| Universal Studios |
3
|
4
|
As the weekend approaches we see wait times start to slide upwards across both parks. Predictions did better at The Studios although we only missed by 7 or 8 minutes at most Islands of Adventure attractions: The Cat in the Hat (7 minutes, predicted 15); One Fish, Two Fish (7 minutes, predicted 12). |
| Islands of Adventure |
5
|
3
|
|
| WHAT WE THOUGHT |
WHAT WE SAW |
ANALYSIS | |
| Universal Studios |
3
|
4
|
Solid predictions again on Friday with none missing by more than a few minutes. At The Studios, only Despicable Me and Transformers reached average waits above the 20 minute mark. |
| Islands of Adventure |
3
|
2
|
|
| WHAT WE THOUGHT |
WHAT WE SAW |
ANALYSIS | |
| Universal Studios |
4
|
4
|
Third day in a row for The Studios to reach a level ‘4’ on our scale and the sixth day of the week with a level below ‘3’ at Islands of Adventure. |
| Islands of Adventure |
4
|
2
|
|
| September 28 to October 4, 2014 |
|---|
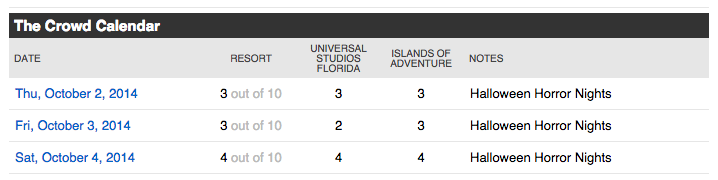
October is busier than September but still offers guests of Universal Orlando a great chance to tour the parks in a relaxed fashion. Wait times are below average, the weather is warm but not as hot as a few weeks prior and the Halloween Horror Nights brings a festive atmosphere to the resort.
To see Universal Orlando Resort Crowd predictions for the days of your vacation, check the Crowd Calendar.![]()
To get details about our predictions of future crowds or details about crowds in the past check out the Crowd Calendar and select “Jump to Date” on the left margin.
You May Also Like...
-

We have had a few weeks to observe the wait times at Universal Orlando Resort since the parks reopened in June.…
-
Disney World parks have reopened and we were surprised to see that Universal Crowd levels appear to be unaffected. Saturday crowds…
-

Crowd levels at Universal Orlando Resort continue to hit record highs and our wait time models are underpredicting as a result.…
-
Locals are still heading to Universal Orlando Parks at record numbers even though the spring break and Easter season is over.…