Disney World Crowd Report – December 7 to 13, 2014
Crowds at Walt Disney World stayed below average all week with only Saturday reaching a resort-wide level ‘5’ on our scale. It seems that our recent adjustments to the crowd predictions are paying off. We saw all predictions come in within two index levels of what we observed except two last week.
Let’s look at how the crowd levels stacked up each day last week on the Touringplans.com Disney World Crowd Report:
| WHAT WE THOUGHT |
WHAT WE SAW |
ANALYSIS | |
|---|---|---|---|
| Magic Kingdom |
3
|
2
|
Sunday’s crowds were mild at all parks with The Studios having the highest crowd level, as predicted. Magic Kingdom saw average posted waits like 26 minutes at Big Thunder Mountain railroad and 24 minutes at Pirates of the Caribbean, both level ‘1’s on our scale. |
| Epcot |
4
|
3
|
|
| Hollywood Studios |
6
|
5
|
|
| Animal Kingdom |
2
|
4
|
|
| WHAT WE THOUGHT |
WHAT WE SAW |
ANALYSIS | |
| Magic Kingdom |
6
|
3
|
Monday’s predictions ended up a little high compared to what we observed at the parks. The level ‘3’ at magic Kingdom ended up as the highest level of the four parks. |
| Epcot |
5
|
2
|
|
| Hollywood Studios |
4
|
2
|
|
| Animal Kingdom |
2
|
1
|
|
| WHAT WE THOUGHT |
WHAT WE SAW |
ANALYSIS | |
| Magic Kingdom |
2
|
3
|
Tuesday’s crowds were not much busier than Monday but our predictions did much better with none missing by more than one level. Extra Magic Hour morning at Epcot brought average posted waits like 11 minutes at Living with the Land and 58 minutes at Test Track (predicted 56). |
| Epcot |
3
|
3
|
|
| Hollywood Studios |
2
|
2
|
|
| Animal Kingdom |
2
|
2
|
|
| WHAT WE THOUGHT |
WHAT WE SAW |
ANALYSIS | |
| Magic Kingdom |
5
|
4
|
Another slow day resort-wide on Wednesday. Only Magic Kingdom, the most crowded park as predicted, managed a crowd level above ‘2’. Average posted waits at Toy Story Mania and Rock ‘n’ Roller Coaster were 54 and 28 minutes respectively (predicted 66 and 29). |
| Epcot |
3
|
1
|
|
| Hollywood Studios |
1
|
1
|
|
| Animal Kingdom |
3
|
2
|
|
| WHAT WE THOUGHT |
WHAT WE SAW |
ANALYSIS | |
| Magic Kingdom |
3
|
1
|
Thursday’s wait times were the lowest resort-wide that we have seen since early September at Disney World. Averages like 8 minutes at Splash Mountain, 50 at Soarin’, 16 at Star Tours and 12 minutes at Kilimanjaro Safaris. |
| Epcot |
3
|
1
|
|
| Hollywood Studios |
2
|
2
|
|
| Animal Kingdom |
2
|
2
|
|
| WHAT WE THOUGHT |
WHAT WE SAW |
ANALYSIS | |
| Magic Kingdom |
3
|
2
|
Friday brought slight bumps in crowds at Epcot and The Studios compared to Thursday, as predicted. Test Track hit 66 minutes (predicted 61) and Tower of Terror averaged 31 minutes (predicted 29). |
| Epcot |
4
|
5
|
|
| Hollywood Studios |
3
|
3
|
|
| Animal Kingdom |
2
|
1
|
|
| WHAT WE THOUGHT |
WHAT WE SAW |
ANALYSIS | |
| Magic Kingdom |
6
|
6
|
Saturday’s predictions hit the mark except at Animal Kingdom where we saw one of our two misses by more than 2 index levels. The ‘6’ at Magic Kingdom was in-line with larger crowds that we had observed on Saturdays in November and December, which prompted our recent update. |
| Epcot |
5
|
4
|
|
| Hollywood Studios |
5
|
4
|
|
| Animal Kingdom |
3
|
6
|
|
| December 14 to 20, 2014 |
|---|
One more week of pre-Christmas crowds before the madness begins. Guests visiting this week should experience moderate crowds at worst while the festive atmosphere begins to crescendo towards the holidays.
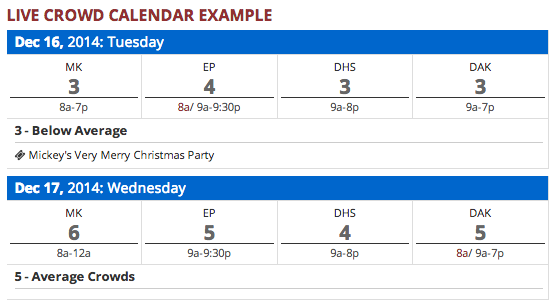
To see Walt Disney World Crowd predictions for the days of your vacation, check the Crowd Calendar.![]()
To get details about our predictions of future crowds or details about crowds in the past check out the Crowd Calendar and select “Jump to Date” on the left margin.
You May Also Like...
-

Crowded theme parks during the Christmas holiday are as certain as death and taxes. Every year we see crowd levels hit…
-
This weekend will have the longest park hours since Walt Disney World re-opened in July. Extended park hours are a signal…
-
The April Crowd Calendar update only has minor changes. We are halfway through spring break, and crowd levels have been in-line…
-

The December Crowd Calendar update is now live. We are in the busiest time of year at Walt Disney World. During…
It felt like this week had the most accurate predictions we have seen since the whole FastPass+ stuff started. More like the good ol’ days.
We were staying at Old Key West from Dec 4-13. Crowds predictions were pretty spot on after adjustments and were very helpful. There is something to be said however about groups of 25-100 tween cheerleaders doing cheers in the parks, just make it seem more crowded! When we were walking through the parks we would often here from our 2 kids ” oh no, here come more cheerleaders!”. We also got stuck behind large groups of them a few times in the fastpass+ line which added to the wait time.