Walt Disney World Crowd Calendar Update for February 2019
February is here, and we continue our monthly schedule of updates to the Disney World Crowd Calendar. In January, Disney announced dates for Mickey’s Not-So-Scary Halloween Party and summer discounts (including free dining). The announcements, ongoing Priceline Express deals, and unofficial information suggest that bookings are light. We expect many guests are postponing their Walt Disney World vacations until Star Wars: Galaxy’s Edge and other new offerings are opened. Disney will continue to advertise and offer incentives to keep attendance up.
February 2019
(Average Crowd Levels: MK 5.9; EP 5.2; HS 5.4; AK 5.6)
The week of Presidents’ Day (February 18) and the Princess Half Marathon (February 21-24) will be the busiest time of the month. The rest of the month will see low crowd levels. It’s 20 days out, and the Princess Half Marathon is not sold out. Attendance was down for the Walt Disney Marathon in January. We are watching to see if the trend continues.
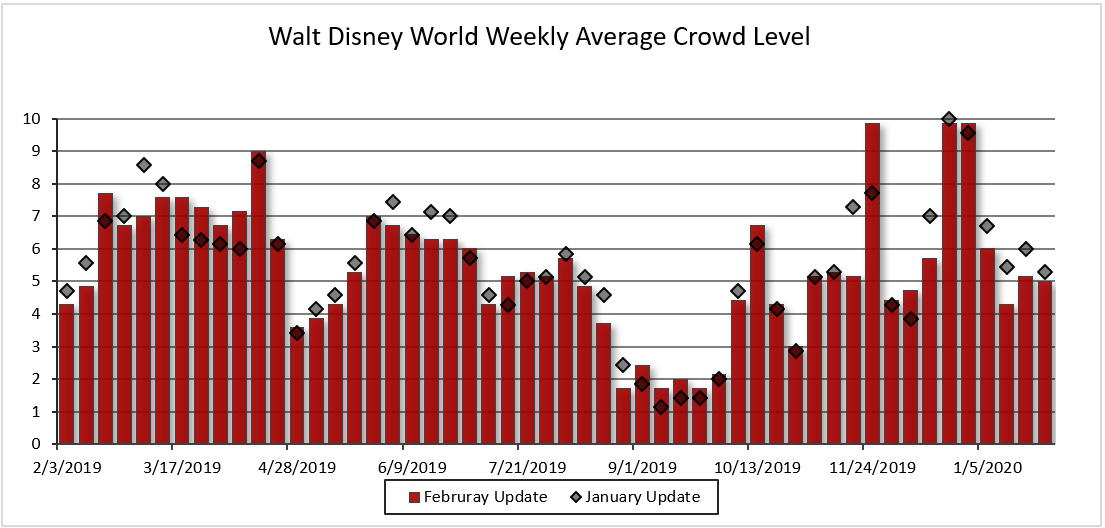
This update shows a slight increase for Presidents’ Day week and a decrease for the rest of the month. These final tweaks are related to changes in Disney posted park hours.
March 2019
(Average Crowd Levels: MK 7.7; EP 7.1; HS 7.6; AK 7)
Mardi Gras (March 5) is late in 2019. Often Mardi Gras crowds overlap with Presidents’ Day, but that will not be an issue in 2019. Fewer schools are off for Mardi Gras this year, and it shouldn’t have a major impact on crowds. The latest update has the crowd levels moderating. The first third of the month the crowd level decreased, with a slight increase for the remainder of the month. The moderate temperatures and spring break will bring guests to the park. In 2019 the “spring break” season will span from March 15 to April 21.
April 2019
(Average Crowd Levels: MK 7.1; EP 6.6; HS 6.5; AK 7.1)
Easter (April 21) is late in 2019. A late Easter means that spring break crowds are spread across a wider time range. The week of April 14 will be the busiest week for spring break. This is the week before Easter and is the week when most schools have off. After Easter, crowds will drop off significantly.
May 2019 (Average Crowd Levels: MK 4.7; EP 5.3; HS 5; AK 5.1)
June 2019 (Average Crowd Levels: MK 6.5; EP 6.7; HS 6.1; AK 5.8)
July 2019 (Average Crowd Levels: MK 5.4; EP 4.4; HS 5.2; AK 5.4)
August 2019 (Average Crowd Levels: MK 4.2; EP 3.7; HS 3.9; AK 4.7)
2017 and 2018 had moderate summer crowd levels. We expect the trend to continue in 2019. The summer heat and expectations of new attractions coming late 2019 will keep crowds down. Disney is offering a Free Dining promotion for hotel stays starting on July 5. Free Dining is a very popular fall promotion and having it in the summer will be the first chance for some families to take advantage of it. This is definitely a strategy to attract guests. Hotel bookings for 2019 are light. Memorial Day, Independence Day, and Labor Day will see the highest crowds of the summer.
September 2019 (Average Crowd Levels: MK 2.2; EP 2.5; HS 2; AK 2.3)
October 2019 (Average Crowd Levels: MK 4.1; EP 5.2; HS 5; AK 4.5)
November 2019 (Average Crowd Levels: MK 6.2; EP 6.5; HS 6.5; AK 6.5)
The fall is going to see the opening of new hotels, transportation, Mickey & Minnie’s Runaway Railroad, and Star Wars: Galaxy’s Edge. Until Disney announces firm opening dates, guests are holding off booking their vacations. Unless Galaxy’s Edge opens early, we expect Free Dining to be extended beyond September 30. We are using September 1 as an estimate for the opening date of Runaway Railroad. This only an estimate and we don’t have any special insight into the actual opening. A different opening date will have an effect on the crowd level predictions.
September has the lowest crowds of the year. Once Labor Day is over, kids are back in school. Fall break has become more popular across the U.S., causing October crowds to start approaching spring break crowds. The Mickey’s Not-So-Scary Halloween Party schedule has been released and is the biggest driver for crowd level changes in this update. Thanksgiving is late in 2019. This will give an extra week to the early November low crowds.
December 2019 (Average Crowd Levels: MK 6.5; EP 6.8; HS 7.1; AK 7.3)
January 2020 (Average Crowd Levels: MK 5.4; EP 5.1; HS 6.1; AK 6.2)
Regardless of when Star Wars: Galaxy Edge opens, the weeks of Christmas and New Year’s are the busiest times. There is a lull in the crowds between Thanksgiving and Christmas.
The current December crowds are a reflection on current trends. We expect to see large increases in crowds at the Disney Studios, some of which will spill over into the other parks when Galaxy’s Edge opens. Next month’s updates will have the first set of model updates designed to predict ‘new land’-level changes in the Studios, and that will be a better estimate of what crowds will look like across the board.
What We are Watching
2019 will be the first full year of Disney’s new date-specific pricing scheme. It’s going to take a year to see how that affects crowd patterns.
The million dollar question for 2019 is: “When will Star Wars: Galaxy’s Edge open?” Disney’s marketing department has changed the open date from “late fall 2019” to “fall 2019.” Some people assume the change means an earlier opening date. I say it is just marketing. As soon as Disney has a firm date, the company will announce it. Star Wars: Galaxy Edge will increase crowds at Walt Disney World. We are assuming Disney will have Disney Vacation Club and Annual Passholder previews as occurred for Pandora – The World of Avatar. The previews will increase the crowd levels across the resort. The excitement of Star Wars: Galaxy Edge is going to extend for all of 2020. Expect fewer discounts, higher prices, and larger crowds.
You May Also Like...
-

This weekend will have the longest park hours since Walt Disney World re-opened in July. Extended park hours are a signal…
-

The October Crowd Calendar update is now live. We skipped September to give the models a chance to digest the data with Star…
-
June is here, and it is time for another Crowd Calendar update. Disney introduced a new summer One World Ticket. The…
-
The February 2020 Crowd Calendar update is now live. So far 2020 is showing increased crowds at Walt Disney World. We…
Thanks so much for sharing this!! We are very excited about doing this. Thanks again!
Any signs that WDW is throttling back ride capacity so far this 2019, the way they did in Jan-Feb 2019?
I love the thoughtful explanations of busy/lighter times. You’ve even got cheerleading/dance competitions! Too many crowd calendars eschew the context. Yours is one of the few we recommend using.
+1 I agree.
Do you expect any change in CLs for week of May 17-23?
The current predictions are the best predictions at this time. Schools are all in session, and wait times should be low.
Any signs that WDW is throttling back ride capacity so far this year, the way they did in Jan-Feb 2018?
Fred just mentioned seeing some unusually high wait times at Animal Kingdom. We will be checking to see if this is due to lower capacity.
Steve is there any update on this? Animal Kingdom was supposed to be a CL2 yesterday and turned out a CL10 !!!!
I saw that too, Simon. We’re looking at it. The other parks were 5, 3, and 4; Universal’s were 3 and 3. My first instinct is to see if something went wrong operationally at the park, because an actual 10 on an unremarkable Thursday in early February isn’t likely.
Thanks Len. I asked on the Lines app and some think it’s Disney limiting capacity, only one dock loading on the Safari for instance. We’ll be interested to see what you learn.
I counted people on the ride on Wednesday in AK. They were running at close to 100%.
I think the posted wait times yesterday were very, very wrong at Animal Kingdom. For example, in a 2-minute span the posted wait for Everest went from 115 to 30. It’s impossible for that to be accurate. I mean, even if Disney had the entire track filled with trains, people just don’t walk that fast through the lines.
Likewise, Primeval Whirl from 65 to 20 in 7 minutes and 60 to 20 and 55 to 20 later; Adventurers Outpost from 50 to 10; Dinosaur 65 to 20; Safaris from 95 to 35 in 30 minutes.
Hi Steve,
Can you provide a little more insight into the underlying data and other factors that contribute to the increases in the forecasts for March and April? I have a vacation planned for my family during the week of March 16-23, and the new crowd levels scare me. This is only my second time ever using TouringPlans.com. As a data analyst myself, I’m just trying to get a better understanding of the source data. Does the forecast factor any actual spring break schedules, or is it based solely on historical data?
I don’t work for TP, but I do know they’ve said elsewhere that they do take school calendars into account, among a large number of other factors.
In regards to the CL’s increasing, don’t panic! It will be fine. For more info on what I mean, see https://forum.touringplans.com/t/everyone-take-a-breath-about-crowd-levels-its-not-the-end-of-the-world/53349
We track the largest school district in each state, plus any other school districts in the top 100. Plus additional school districts in Florida and California. about 20% of school districts always have their spring break the week before Easter.
I’m going the week of President’s Day, and I’m a little confused – my CL’s for most of the week went up a level or two, but my wait times went down (without really changing the order of many of the attractions). Any thoughts on why this is the case? It’s a little confusing…
An optimized Touring Plan is going to arrange the attractions to minimize wait times. Crowd levels are based on the average wait times for the core of the day. It is possible that the times you are scheduled to go to the attractions the wait time predictions went down, but the overall average wait times went up.
First week of Spring Break everything went up a couple of levels – I fully expected that. As long as it’s not 10’s across the board I will be happy. Rope Drop and a good touring plan will see you through the busiest of times!
I was thrilled to see the AK crowd level drop from a 4 to a 1 on the day I’m going next week (2/5) however I was surprised that the wait time for FOP actually went up instead of down as I would have expected. Any reason for this?
11/5/19 MK jumped from a 2 to an 8, eek! I was already concerned about being there for Jersey Week. Is there another reason for the jump? Did they release dates for the Very Merry Christmas Party? Other parks decreased that day so I guess I will rearrange my plans. Thank you for always being on top of things!
Thanks for this Steve. It’d be really helpful to understand what’s changed to bring down figures from the big leaps we saw last month. For example the beginning of March had ten CL10 days at AK. Now those are 7-8.
What’s behind those and other similar corrections (which all of us going then are delighted to see I might add!).
The biggest change in the models this month is that we put less weight on the 2018 data. Easter is later this year, and it brings the early spring crowd levels down. In November, Thanksgiving is a week later and the 2018 data was causing the week before Thanksgiving 2019 too high.
Thanks Steve, good to know!
I’ll be there Sat. 2/2 – Wed 2/13 and I saw an average decrease for my park days of more than 1 crowd level per day. Interestingly, many of these went right back to where they were before the increase from the January update. I had a feeling there were some overestimates in there. Let’s hope the downward trend continues (and is accurate)!
Going Presidents week and my email showed more slight decreases than increases.
Me too!
More room for me in August! Thx for the updates